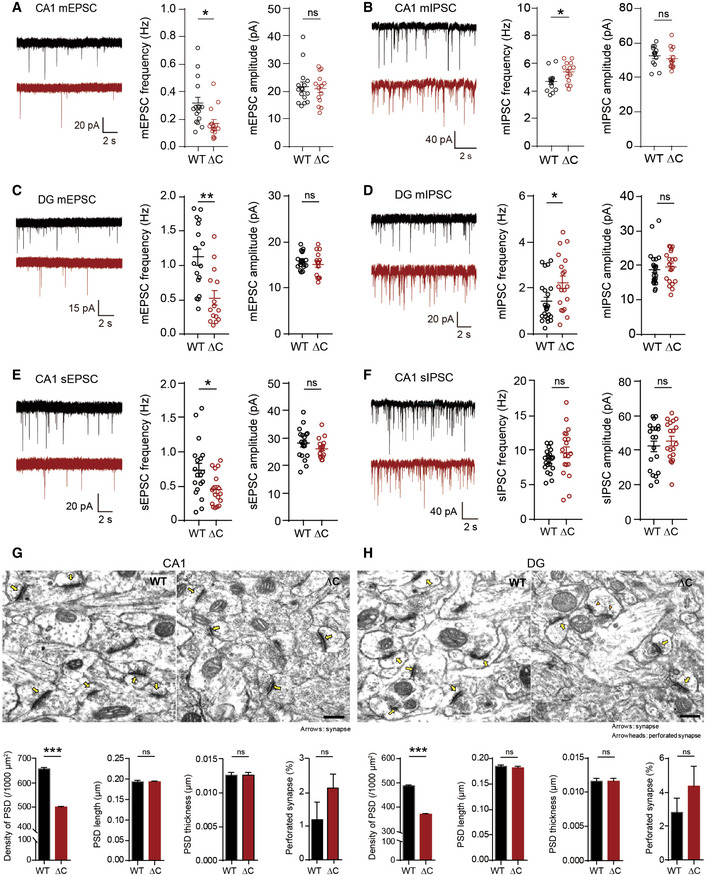
Figure EV2. Reduced mEPSC frequency, increased mIPSCs frequency, and reduced density, but normal morphology, of the PSD in hippocampal DG and CA1 regions in PtenΔC / ΔC mice.

-
A, BReduced frequency of mEPSCs (A) and increased frequency of mIPSCs (B) in CA1 pyramidal cells in the hippocampus of PtenΔC / ΔC mice (P17–21 for mEPSCs; P18–21 for mIPSCs). Data represent mean + SEM (mEPSC, n = 15 neurons from three mice for WT and 14 (3) for ΔC; mIPSC, 13 (4) for WT, and 14 (4) for ΔC; *P < 0.05, ns, not significant, Student's t‐test and Mann–Whitney U‐test; See Appendix Table S1 for details).
-
C, DReduced frequency of mEPSCs (C) and increased frequency of mIPSCs (D) in DG granule cells in the hippocampus of PtenΔC / ΔC mice (P18–19 for mEPSCs; P18–23 for mIPSCs). (mEPSC, n = 17 (3) for WT and 14 (3) for ΔC; mIPSC, 23 (5) for WT and 19 (5) for ΔC; *P < 0.05, **P < 0.01, ns, not significant, Student's t‐test and Mann–Whitney U‐test). The error bars represent SEM.
-
E, FReduced frequency of sEPSCs (E), but normal sIPSCs (F), in CA1 pyramidal neurons in the hippocampus of PtenΔC / ΔC mice (P17–19 for sEPSCs; P17–21 for sIPSCs). (sEPSC, n = 19 (4) for WT and 17 (4) for ΔC; sIPSC, 20 (4) for WT and 19 (4) for ΔC; *P < 0.05, ns, not significant, Student's t‐test and Mann–Whitney U‐test). The error bars represent SEM.
-
G, HDecreased density of excitatory synapses in the hippocampal CA1 and DG regions of PtenΔC / ΔC mice. (G), CA1 stratum radiatum; (H), DG molecular layer. Excitatory synapses are defined by sites where PSDs are in contact with presynaptic vesicles. Normal and perforated PSDs are indicated by arrows and arrowheads, respectively. (n = 3 mice for WT and ΔC, ***P < 0.001, ns, not significant, Student's t‐test). Scale bar, 200 nm. The error bars represent SEM.
