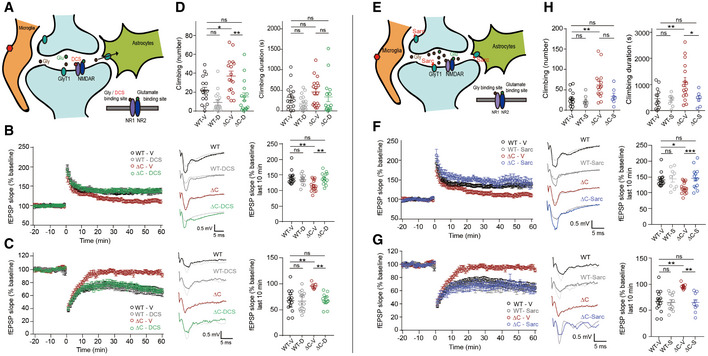
Figure 4. DCS‐dependent NMDAR activation and sarcosine‐dependent GlyT1 antagonization normalize synaptic plasticity and repetitive climbing in PtenΔC / ΔC mice.

- Schematic showing that DCS directly binds to the GluN1 subunit of NMDARs and activates NMDARs. Note that enhanced expression of SLC6A20 in PtenΔC / ΔC microglia and astrocytes surrounding the indicated synapse may decrease synaptic levels of glycine and suppress NMDAR function.
- Normalization of NMDAR‐dependent HFS‐LTP at synapses of PtenΔC / ΔC mice (4–5 weeks) by DCS treatment (20 μM), as shown by fEPSP slopes. (n = 15 slices from nine mice for WT‐V/vehicle, 11 (5) for WT‐D/DCS, 16 (10) for ΔC‐V, 13 (7) for ΔC‐D, **P < 0.01, ns, not significant, two‐way ANOVA with Tukey's test). The gray traces represent the baseline fEPSP prior to LTP induction. The error bars represent SEM.
- Normalization of NMDAR‐dependent LFS‐LTD at synapses of PtenΔC / ΔC mice (P17–22) by DCS treatment (10 μM), as shown by fEPSP slopes. (n = 14 slices from six mice for WT‐V, 13 (4) for WT‐D, seven (4) for ΔC‐V, 13 (3) for ΔC‐D, **P < 0.01, ns, not significant, two‐way ANOVA with Tukey's test). The gray traces represent baseline fEPSP prior to LTD induction. The error bars represent SEM.
- Normalization of excessive climbing frequency (but not duration) by treatment of synapses in PtenΔC / ΔC mice (2–5 months) with DCS (20 mg/kg). (n = 17 mice for WT‐V, 17 for WT‐D, 16 for ΔC‐V, 16 for ΔC‐D, *P < 0.05, **P < 0.01, ns, not significant, two‐way ANOVA with Tukey's test). The error bars represent SEM.
- Schematic showing that NMDAR activation can be induced indirectly through sarcosine‐dependent antagonization of GlyT1, a known glycine transporter, and resultant increases in glycine levels around the synapse.
- Normalization of NMDAR‐dependent HFS‐LTP at synapses of PtenΔC / ΔC mice (4–5 weeks) by sarcosine treatment (750 µM), as shown by fEPSP slopes. Note that the data for WT‐V and ΔC‐V are identical to those shown in Fig 4B because the whole experiments were performed together; we generated independent figures for DCS and sarcosine results for the clear presentation of the data. (n = 15 slices from nine mice for WT‐V/vehicle, nine (4) for WT‐Sarc/Sarcosine, 16 (10) for ΔC‐V/Vehicle, 18 (4) for ΔC‐S, *P < 0.05, ***P < 0.001, ns, not significant, two‐way ANOVA with Tukey's test). The gray traces represent the baseline fEPSP prior to LTP induction. The error bars represent SEM.
- Normalization of NMDAR‐dependent LFS‐LTD at synapses of PtenΔC / ΔC mice (16–21 days) by sarcosine treatment (750 µM), as shown by fEPSP slopes. Note that the data for WT‐V and ΔC‐V are identical to those shown in Fig 4C because the whole experiments were performed together; we generated independent figures for DCS and sarcosine results for the clear presentation of the data. (n = 14 slices from six mice for WT‐V, 11 (7) for WT‐Sarc, seven (4) for ΔC‐V, nine (6) for ΔC‐Sarc, **P < 0.01, ns, not significant, two‐way ANOVA with Tukey's multiple comparison). The gray traces represent baseline fEPSP prior to LTD induction. The error bars represent SEM.
- Normalization of excessive climbing duration (but not frequency) by treatment of synapses of PtenΔC / ΔC mice (2–5 months) with sarcosine (100 mg/kg). (n = 14 mice for WT‐V, eight for WT‐S, 16 for ΔC‐V, seven for ΔC‐S, *P < 0.05, **P < 0.01, ns, not significant, two‐way ANOVA with Tukey's test).
