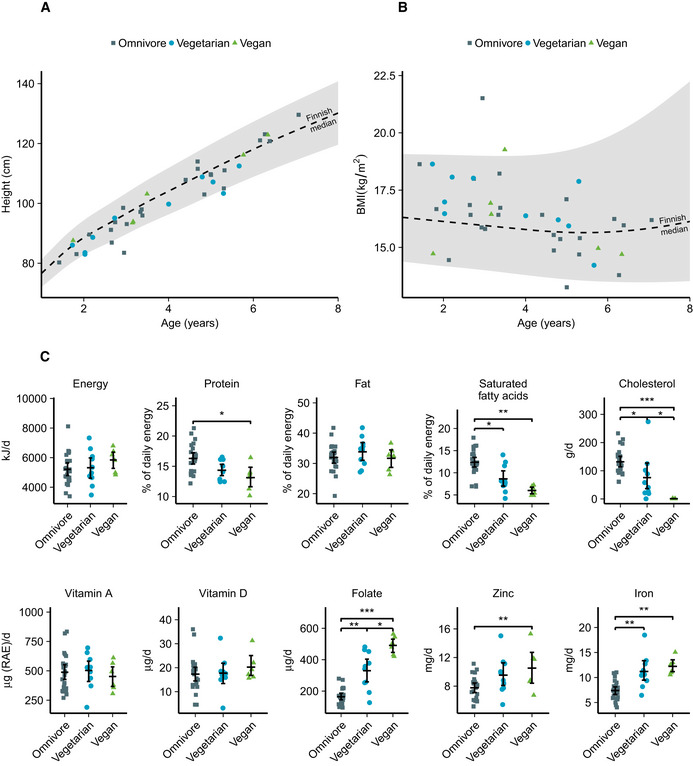
Figure 1. Anthropometric measurements and dietary intake of omnivores, vegetarians, and vegans.

-
A, BHeight (A) and body mass index (B) of the participants by age in the diet groups compared to 2 SD intervals (shaded area) and median in the Finnish reference population.
-
CDietary intake of selected macro‐ and micronutrients of participants.
Data information: The summary bar is presented as mean ± SEM. Differences between diet groups were evaluated with age‐ and sex‐adjusted permutation tests with Benjamini–Hochberg correction for multiple testing. Only significances P < 0.05 are displayed. n = 24 omnivores, 10 vegetarians, six vegans. *P < 0.05, **P < 0.01, ***P < 0.001. Exact P‐values are provided in Table EV1.
Source data are available online for this figure.
