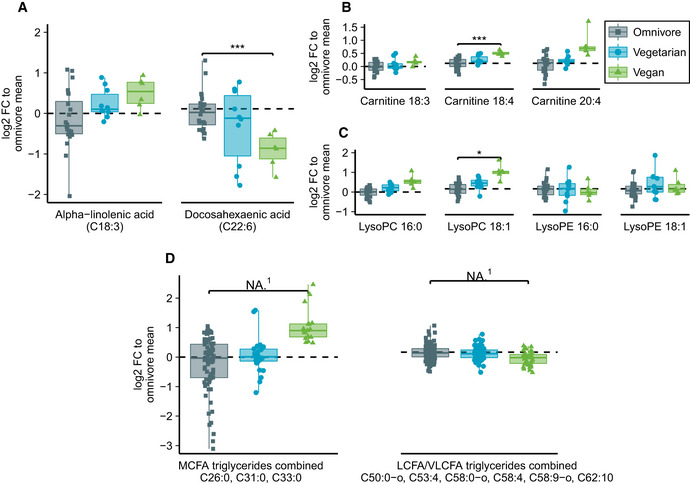
Figure 4. Fatty acid analysis from untargeted MS metabolomics in omnivores, vegetarians, and vegans.

- Fatty acid analysis from untargeted MS metabolomics including free alpha‐linolenic acid (ALA) and docosahexaenoic acid (DHA).
- Carnitine‐bound fatty acids commonly found in serum that were detected in mass spectrometry.
- Lysophosphatidylcholine and lysophosphatidylethanolamine with C16:0 (palmitic acid) and C18:1 (oleic acid).
- Combined analysis of all found triglycerides corresponding to medium‐chain fatty acid lengths and long or very long‐chain fatty acid lengths.
Data information: Box plot center represents group median, hinge covers 25th to 75th percentile and whiskers cover interval from minimum to maximum. Zero‐level represents omnivore mean to which each individual is compared in log2 scale. Differences between diet groups in subfigures (A–C) were evaluated with Student's t‐test (unequal variance, two‐sided) with Benjamini–Hochberg correction for multiple testing. Only significances P < 0.05 are displayed. Exact P‐values are provided in Appendix Table S8. In subfigures (A–C), n = 24, 10, 6 for omnivores, vegetarians, and vegans, respectively. In subfigure (D), multiple‐related metabolites (three MCFAs and six LCFAs/VLCFAs) are combined to same box plot yielding n = 72, 30, and 18 in MCFA subfigure and n = 144, 60, and 36 in (V)LCFA subfigure for omnivores, vegetarians, and vegans, respectively. *P < 0.05, ***P < 0.001, NA, not applicable. Cxx:y, fatty acid of xx carbon atoms and y double bonds; FC, fold change; LysoPC, lysophosphatidylcholine; LysoPE, lysophosphatidylethanolamine; MCFA, medium‐chain fatty acid; LCFA, long‐chain fatty acid; VLCFA, very long‐chain fatty acid. (1) Student's t‐test is not suitable for testing of multiple dependent metabolites in a single test. Of single metabolites included in subfigure (D), Benjamini–Hochberg adjusted t‐test was significant (α = 0.05) for C50:0‐o, C53:4, and C58:0‐o.
Source data are available online for this figure.
