
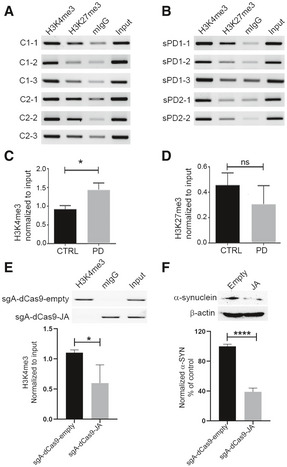
Figure 6. CRISPR/dCas9 SunTag‐JARID1A ameliorates elevated α‐synuclein levels in differentiated PD‐iPSCs by reducing H3K4me3 from the gene promoter.
-
A, BRelative enrichment of H3K4me3 and H3K27me3 at the SNCA promoter/intron 1 region was evaluated from six iPSC lines of two control subjects and five iPSC lines derived from two sporadic PD (sPD) cases by ChIP. The same genomic region as shown in Fig 1 and Appendix Fig S2C was evaluated for enrichment of H3K4me3 and H3K27me3. Mouse IgG (mIgG) was used as control for the target antibody. The relative intensity of the target band was normalized by respective input.
-
CChIP on H3K4me3 at the SNCA promoter between control and sPD1‐1 lines revealed a marginally higher enrichment in sPD lines as compared to the controls.
-
DRelative comparison of H3K27me3 enrichment between control and sPD lines revealed no significant difference between the two groups.
-
EChIP on H3K4me3 at the SNCA promoter between sPD1‐1 lines after locus‐specific epigenomic modulation. Differentiated cells were transiently transfected with either sgA‐dCas9 5xGCN4‐scFV‐JARID1A or sg A‐dCas9 5xGCN4‐scFV‐empty backbone vectors. A significant reduction in H3K4me3 at the SNCA promoter was observed in cells transfected with JARID1A. A representative ChIP image is shown, and the gels for other replicates are presented in Appendix Fig S12C.
-
FWestern blot analysis of α‐synuclein (α‐SYN) levels in the cells under the same conditions as analyzed in (E). A significant decrease (56–66%) in α‐SYN levels was observed in cells transfected with JARID1A. The normalized and relative expression of α‐SYN in JARID1A transfected cells are shown as a percentage of control (transfected by empty backbone vector). A representative Western blot image is shown at the top, the gels for other replicates are presented in Appendix Fig S12D.
Data information: Three independent repeats were performed for both ChIP and Western blot experiments. *P < 0.05; ****P < 0.0001. Data were analyzed using non‐parametric t‐test followed by Mann–Whitney post hoc corrections. One‐tailed P‐values were calculated for ChIP analysis, while two‐tailed P‐value was calculated for Western blot experiments. All data are presented as mean ± SEM.
Source data are available online for this figure.