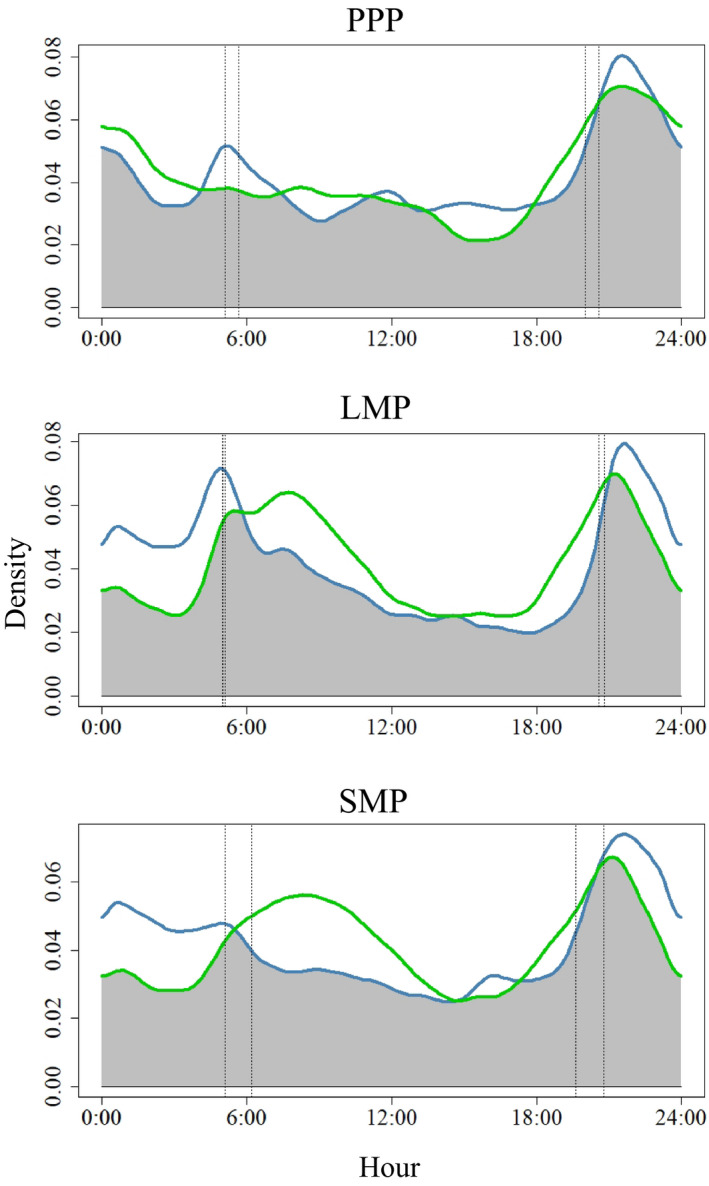
FIGURE 3.

Activity patterns of wolves (green line) and coyotes (blue line) fitted with a kernel density plot showing earliest and latest sunrise and sunset (vertical dashed lines) and overlap (shaded gray) used to calculate activity overlap (Δ) during three time periods related to white‐tailed deer: preparturition period (a, 1–26 May; Δ = 0.92), fawn limited mobility period (b, 27 May–30 June; Δ = 0.86), and fawn social mobility period (c, 1 July–31 August; Δ = 0.86), Michigan's Upper Peninsula, USA, 2013–2015
