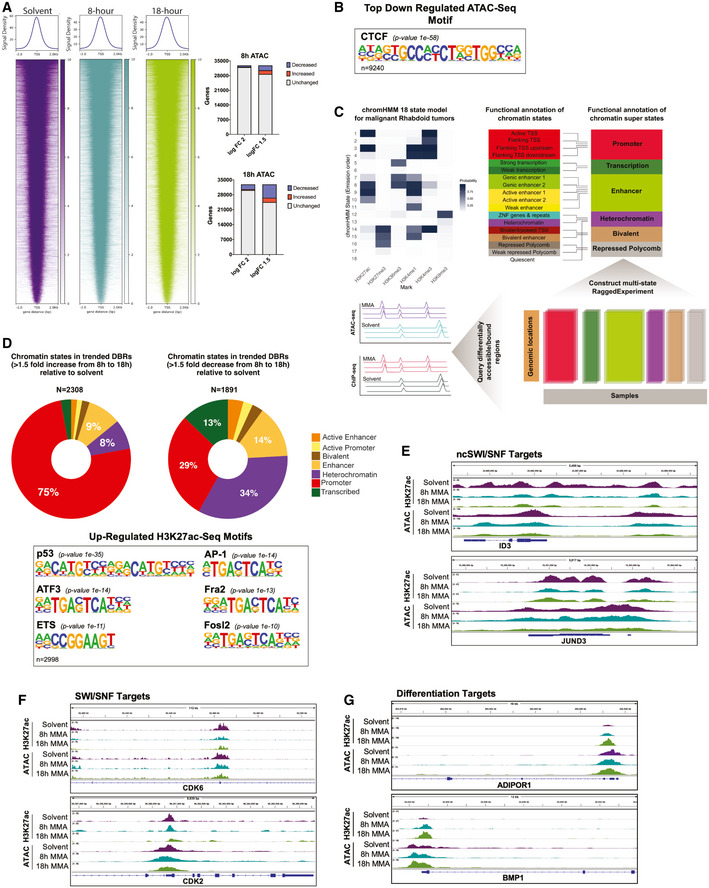
Figure 6. Mithramycin reprograms rhabdoid tumor promoters to trigger a change in cellular state and favor a differentiation phenotype.

- Heatmaps depicting ATAC‐seq global chromatin structure following 8 h (middle) and 18 h (right) 100 nM MMA treatment. A 2 kb window is centered on the TSS. Chromatin accessibility clusters at the TSS and does not change globally relative to solvent. Quantification of genes that gain accessibility or reduce accessibility on the right.
- CTCF is the top downregulated motif from the ATAC‐seq analysis (P = 1e‐58).
- Schematic for the 18 state chromHMM model built for MRTs and collapsed into six super states. Chromatin states were called if the state was present in at least 50% of samples. ATAC‐seq and H3K27ac ChIP‐seq peaks were queried against the six super states. P‐values derived from the homer motif analysis package.
- Donut plots representing the percentage of each chromatin super state across treatment time (from 8 to 18 h) that increased 1.5‐fold (left) or decreased 1.5‐fold (right). Below, Motif analysis of the top upregulated motifs from the H3K27ac ChIP‐seq gene lists that pass a 1.5 logFC. P‐values derived from the homer motif analysis package using a binomial algorithm.
- IGV tracks of rhabdoid tumor genes previously identified to be occupied by non‐canonical SWI/SNF (Michel et al, 2018). ID3 and JUND3 decrease in H3K27ac occupancy and chromatin accessibility following exposure to mithramycin for 8 or 18 h.
- IGV tracks of rhabdoid tumor genes previously identified to gain H3K27me3 upon SWI/SNF loss (Erkek et al, 2019). CDK6 and CDK2 decrease in H3K27ac occupancy and chromatin accessibility following exposure to 8‐ and 18‐h mithramycin treatment.
- IGV tracks of genes identified to have an increase in accessibility, H3K27ac and gene expression following mithramycin exposure. BMP1 and ADIPOR1 play crucial roles in bone and adipogenic differentiation, respectively.
