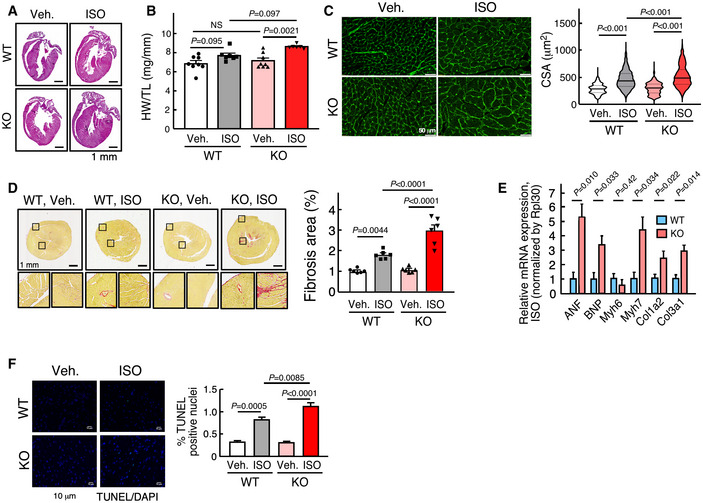
Figure 2. miR‐574 gene knockout augments ISO‐induced pathological cardiac remodeling.

- H&E of hearts from WT and miR‐574−/− mice with or without isoproterenol (ISO) treatment for 4 weeks. Mice were between 8–10 weeks old females.
- Ratio of HW/TL (heart weight/tibia length) in WT and miR‐574−/− mice (n = 8/7/8/6 for 4 groups of WT, Veh.; WT, ISO; KO, Veh.; KO, ISO).
- WGA (wheat germ agglutinin) staining in WT and miR‐574−/− mice. Cross‐sectional area (CSA) of CMs was measured and quantified (n ≥ 500 cells). Scale bar: 50 μm. In the violin plot, black line shows median value for the group and peach dashed lines represent two quartile lines in each group.
- Picrosirius red staining in WT and miR‐574−/− mice (n = 6 per group). Scale bar: 1 mm.
- RT–qPCR of fetal cardiac genes in WT and miR‐574−/− mice with ISO treatment (n = 3 per group). ANF, atrial natriuretic factor; BNP, B‐type natriuretic peptide; Myh6/Myh7, myosin heavy polypeptide 6/7; Col1a2/Col3a1, procollagen, type I, α2; type III, α1.
- TUNEL assay for heart tissue sections from WT and miR‐574−/− mice under ISO versus vehicle treatment (n = 6 per group). Scale bar: 10 μm.
Data information: Data were presented as mean ± SEM. P values were calculated by unpaired two‐tailed Student t test (E), Kruskal–Wallis test with Dunn’s multiple comparisons test (C), or two‐way ANOVA with Tukey’s multiple comparisons test (B, D, F).
Source data are available online for this figure.
