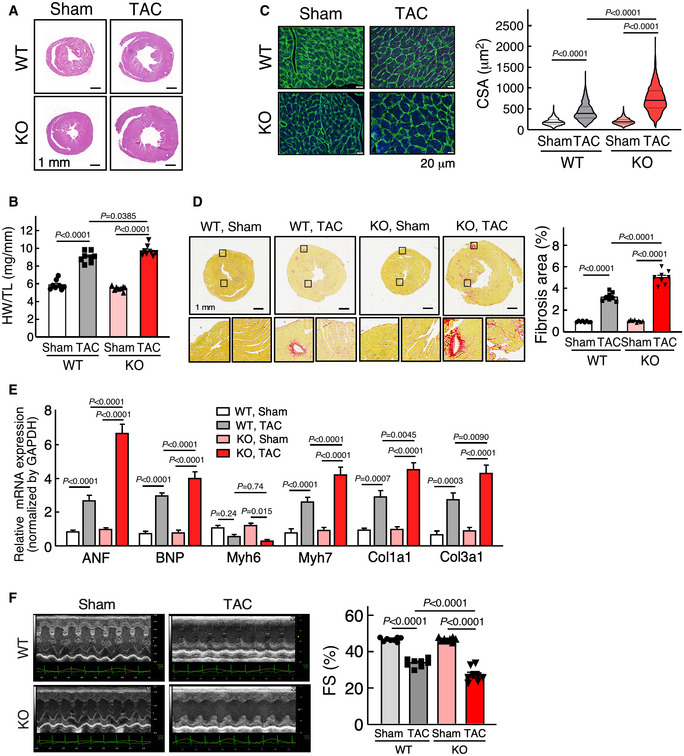
Figure 3. miR‐574 gene knockout augments TAC‐induced pathological cardiac remodeling.

- H&E staining of hearts from WT and miR‐574−/− mice 4 weeks after transverse aortic constriction (TAC) surgery.
- Ratio of HW/TL in WT and miR‐574−/− mice (n = 8 per group).
- WGA staining of hearts from WT and miR‐574−/− mice 4 weeks after TAC surgery (n ≥ 500 cells). Scale bar: 20 μm. In the violin plot, black line shows median value for the group and peach dashed lines represent two quartile lines in each group.
- Picrosirius red staining of hearts from WT and miR‐574−/− mice under TAC surgery (n = 8 per group). Scale bar: 1 mm.
- RT–qPCR of fetal cardiac genes in WT and miR‐574−/− mice with TAC surgery (n = 4 per group).
- Echocardiography measurement of cardiac functions of hearts from WT and miR‐574−/− mice 4 weeks post‐TAC (n = 8 per group). FS, fractional shortening.
Data information: Data were presented as mean ± SEM. P values were calculated by Kruskal–Wallis test with Dunn’s multiple comparisons test (C) or two‐way ANOVA with Tukey’s multiple comparisons test (B, D‐F).
Source data are available online for this figure.
