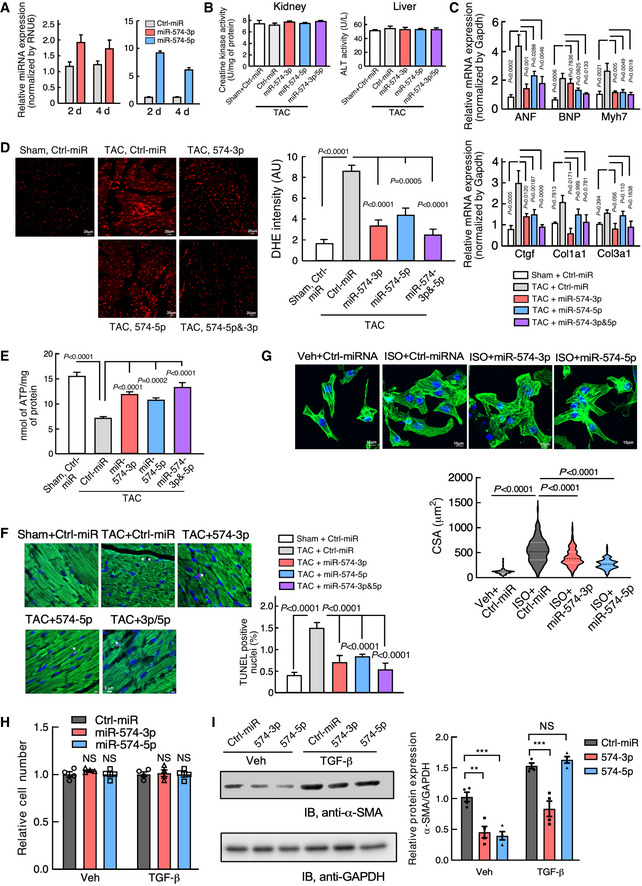
Figure EV3. Phenotypic characterization of the therapeutic model using miR‐574‐5p/3p mimic injection in mice subject to TAC surgery.

- RT–qPCR of miR‐574‐5p and miR‐574‐3p after injections of the miRNA mimics for 2 or 4 days. N = 4 per group.
- Creatine kinase test and alanine transaminase (ALT) assay in kidneys and livers from miRNA mimic injected mice. N = 4 per group. TAC: transverse aortic constriction; Sham is control mock surgery for TAC surgery (no constriction).
- RT–qPCR of hypertrophy and fibrosis marker genes in the hearts of therapeutic mouse models. N = 5 per group.
- DHE staining of frozen sections of hearts from WT mice under treatment with miRNA mimics in TAC‐induced HF mouse models. Sham operation was used as a control for TAC. N = 4 per group. Scale bar: 20 μm.
- ATP level in heart lysates from WT mice under treatment with miRNA mimics in TAC‐induced HF mouse models (6 weeks post‐surgery). N = 4 per group.
- TUNEL assay of murine hearts in the therapeutic models. N = 4 per group. Scale bar: 5 μm. Green color: α‐actinin immunostaining signal. Red color: TUNEL signal. Blue color: DAPI signal.
- miR‐574‐5p and miR‐574‐3p decreased ISO‐activated mouse CM hypertrophy. Isolated mouse primary neonatal CMs were stained by FITC phalloidin. The cells were transfected with negative control miRNA, miR‐574‐3p, and miR‐574‐5p mimics, followed by ISO (10 μm) treatment for 24 h. N> 100 cells/group. Scale bar: 10 μm. The dashed line in the violin plot shows medium value for the group and the dotted lines represent two quartile lines in each group.
- Mouse primary CF cell proliferation measured by the CyQUANT cell proliferation kit. N = 4 per group. NS: not significant (compared to Ctrl‐miR group).
- Western blot measurement of α‐SMA in TGF‐β (10 ng/ml; 24 h) treated mouse primary CF cells. The protein expression was quantified from 4 biological replicates in the right panel. *P < 0.05; **P < 0.01; ***P < 0.001.
Data information: Data were presented as mean ± SEM. All the analyses in (B‐F) were performed 6 weeks post‐surgery for in vivo experiments. P values were calculated by one‐way ANOVA with Tukey’s multiple comparisons test (C‐F, H), unpaired two‐tailed Student t test (G), and two‐way ANOVA with Tukey’s multiple comparisons test (I).
Source data are available online for this figure.
