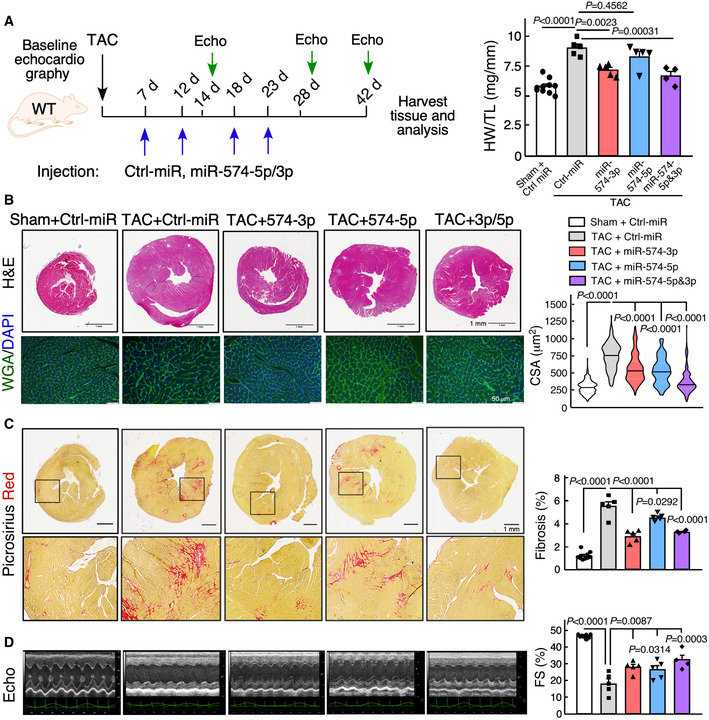
Figure 4. The therapeutic benefit of miR‐574‐5p/3p against cardiac pathological remodeling.

- The schematic of therapeutic treatment of the TAC model using miRNA mimics followed by phenotypic characterizations. HW/TL ratio is measured (n = 4–10 per group). Ctrl‐miR: negative control miRNA mimics.
- H&E and WGA staining of murine hearts in the therapeutic models. Scale bar: 1 mm for H&E and 50 μm for WGA. Cardiomyocyte surface area was quantified from WGA staining in the right panel. >120 CMs are quantified in each group. The black line shows medium value for the group and the dotted lines represent two quartile lines in each group.
- Picrosirius red staining of murine hearts in the therapeutic models. Scale bar: 1 mm. The fibrotic area was quantified in the right panel (n = 4–10 per group).
- Echocardiography analysis of the cardiac function of mice in the therapeutic models at the endpoint of 6 weeks post‐surgery (n = 4–10 per group).
Data information: Data were presented as mean ± SEM. P values were calculated by Kruskal–Wallis test with Dunn’s multiple comparisons test (A) or one‐way ANOVA with Tukey’s multiple comparisons test (B‐D).
Source data are available online for this figure.
