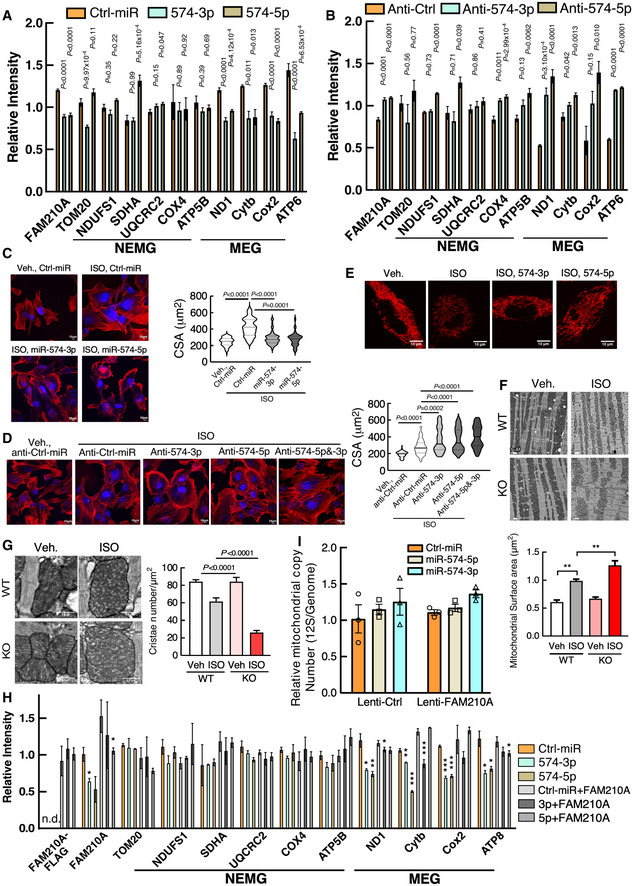
Figure EV4. miR‐574‐FAM210A axis modulates mitochondrial protein expression and mitochondrial activity in AC16 cardiomyocyte cells.

-
A, BQuantitative analysis of Western blot data from Fig 8C and D. n.d., not detected. Each experiment was done in triplicates.
-
CISO (isoproterenol)‐induced cardiomyocyte hypertrophy indicated by phalloidin staining in human AC16 CM cells treated with miRNA mimics (100 nM for 24 h). N> 110 cells/group. Scale bar: 10 μm. The black line in the violin plot shows medium value for the group and the dotted lines represent two quartile lines in each group.
-
DISO‐induced CM hypertrophy in AC16 cells treated with anti‐miR inhibitors (10 μM ISO and 100 nM anti‐miR inhibitor treatment for 24 h). N = 110–150 cells/group. Scale bar: 10 μm.
-
ERepresentative TMRE staining images of AC16 CM cells. Scale bar: 10 μm.
-
F, GTransmission electron microscopy analysis of mitochondrial surface area and cristae number. 60–150 mitochondria were quantified from 3 hearts. Scale bar: 1 μm and 0.5 μm. **P < 0.01.
-
HQuantitative analysis of Western blot data from Fig 8I. Each experiment was done in triplicates. Control AC16 cells and cells with FAM210A stable overexpression were treated with 10 μM ISO for 24 h, followed by transfection of 100 nM of miRNA mimics. *P < 0.05; **P < 0.01; ***P < 0.001.
-
IMeasurement of mitochondrial copy number in AC16 cells transfected with Ctrl‐miR, miR‐574‐5p, miR‐574‐3p in the presence or absence of FAM210A overexpression. N = 3 per group.
Data information: Data were presented as mean ± SEM. P values were calculated by one‐way ANOVA (A, B), Kruskal–Wallis test with Dunn’s multiple comparisons test (C, D), one‐way ANOVA with Tukey’s multiple comparisons test (F, G), or two‐way ANOVA with Tukey’s multiple comparisons test (H).
