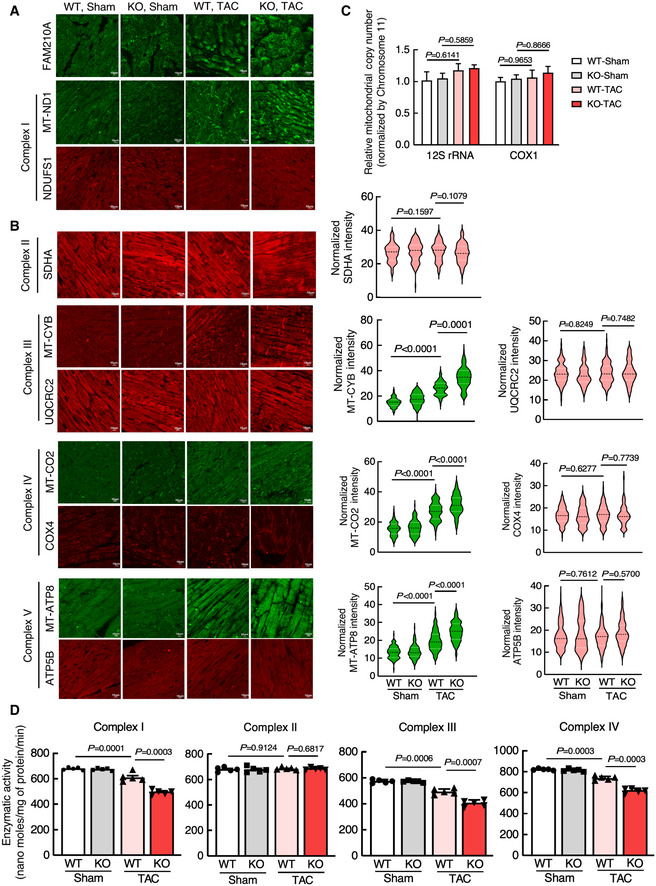
Figure EV5. miR‐574‐FAM210A axis modulates mitochondrial protein expression and mitochondrial activity in murine hearts.

-
A, BIF analysis of protein expression of ETC complex protein components in WT and miR‐574 KO hearts 3 days after TAC surgery. n = 5 hearts per group with> 100 CMs measured per group. Scale bar: 10 μm. The dashed line in the violin plot shows medium value for the group and the dotted lines represent two quartile lines in each group.
-
CMeasurement of mitochondrial copy number in WT and miR‐574 KO hearts 3 days after TAC surgery (n = 4).
-
DMeasurement of mitochondrial electron transport chain complex enzymatic activities in heart lysates of WT and miR‐574 KO mice at 4 weeks after TAC or Sham surgery (n = 5 per group).
Data information: Data were presented as mean ± SEM. P values were calculated by two‐way ANOVA with Tukey’s multiple comparisons test (B‐D).
Source data are available online for this figure.
