Fig. 2.
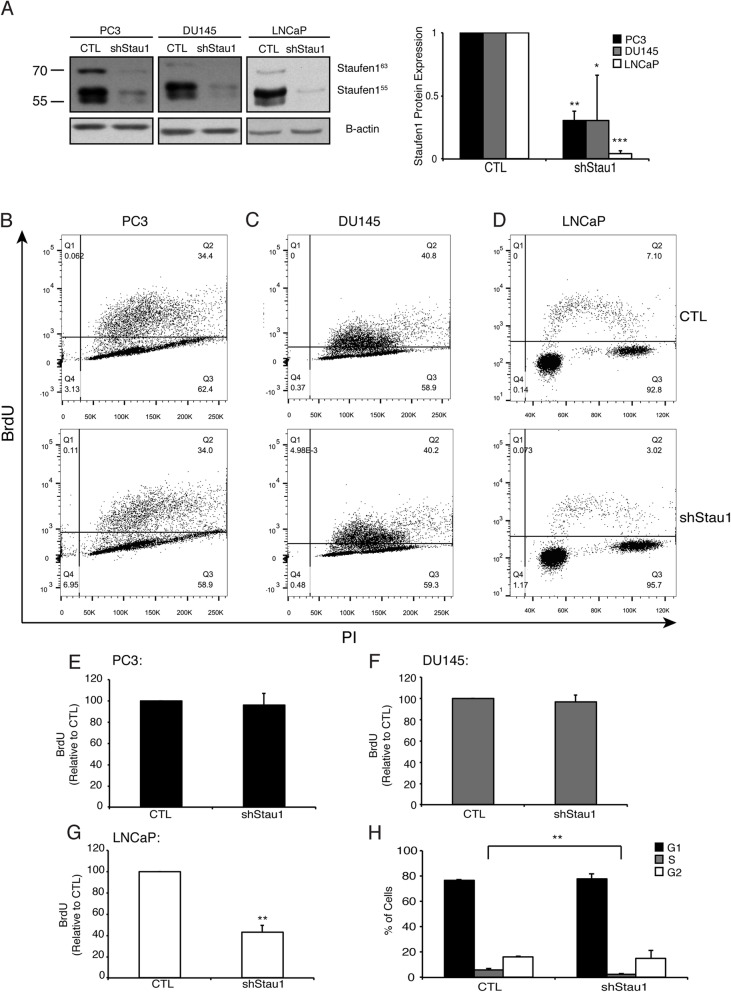
Staufen1 regulates the proliferation and cell cycle of LNCaP cells. Analysis of cell proliferation was performed after 48 h of Control (CTL) or Staufen1-shRNA expression (shStau1) in all three PC cell lines. a Representative western blot of Staufen1 expression with B-actin as a loading control in PC3, DU145, and LNCaP cells. Each representative blot is cropped to show an n = 1 for each cell line from their respective full-length blot. Note that the LNCaP cells used for Fig. 1 experiments were also used for Figs. 1 and 3 and therefore a different representative image from the same blot was selected for Fig. 2. Quantification is represented normalized to CTL (n = 3). b-d Proliferation was assessed by two-parameter flow cytometry and representative dot plots following 2 h of BrdU incorporation and Propidium Iodide (PI) staining in PC3, DU145, and LNCaP cells expressing CTL or Staufen1-shRNAs. e-g Quantification of BrdU incorporation is represented as a percentage relative to CTL in all three PC cell lines (n = 3). h the percentage of the cells in G1, S and G2 phases are indicated. Data are Mean ± SD, One-Sample T-Test, *P < 0.05, ** P < 0.01, ***P < 0.001. Full length blots are presented in Supplemental Fig. 4

