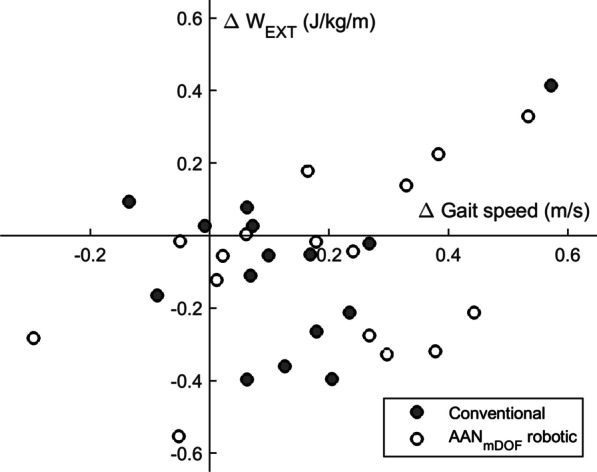
Fig. 4.

Individual change in gait speed plotted against the individual change in external mechanical work from T0 to T1, for individuals in the AANmDOF robotic and conventional gait training groups. Only data of individuals who completed both assessments at T0 and T1 are shown (n = 31). Positive change indicates an increased value of the variable at T1 relative to T0. Preferably, participants would be in the right lower quadrant (increased gait speed / decreased external work) or lower part of the right upper quadrant (increased gait speed / slightly increased external work)
