
Fig. 3. Heat map comparing normal and burn serum cytokine protein expression profiles.
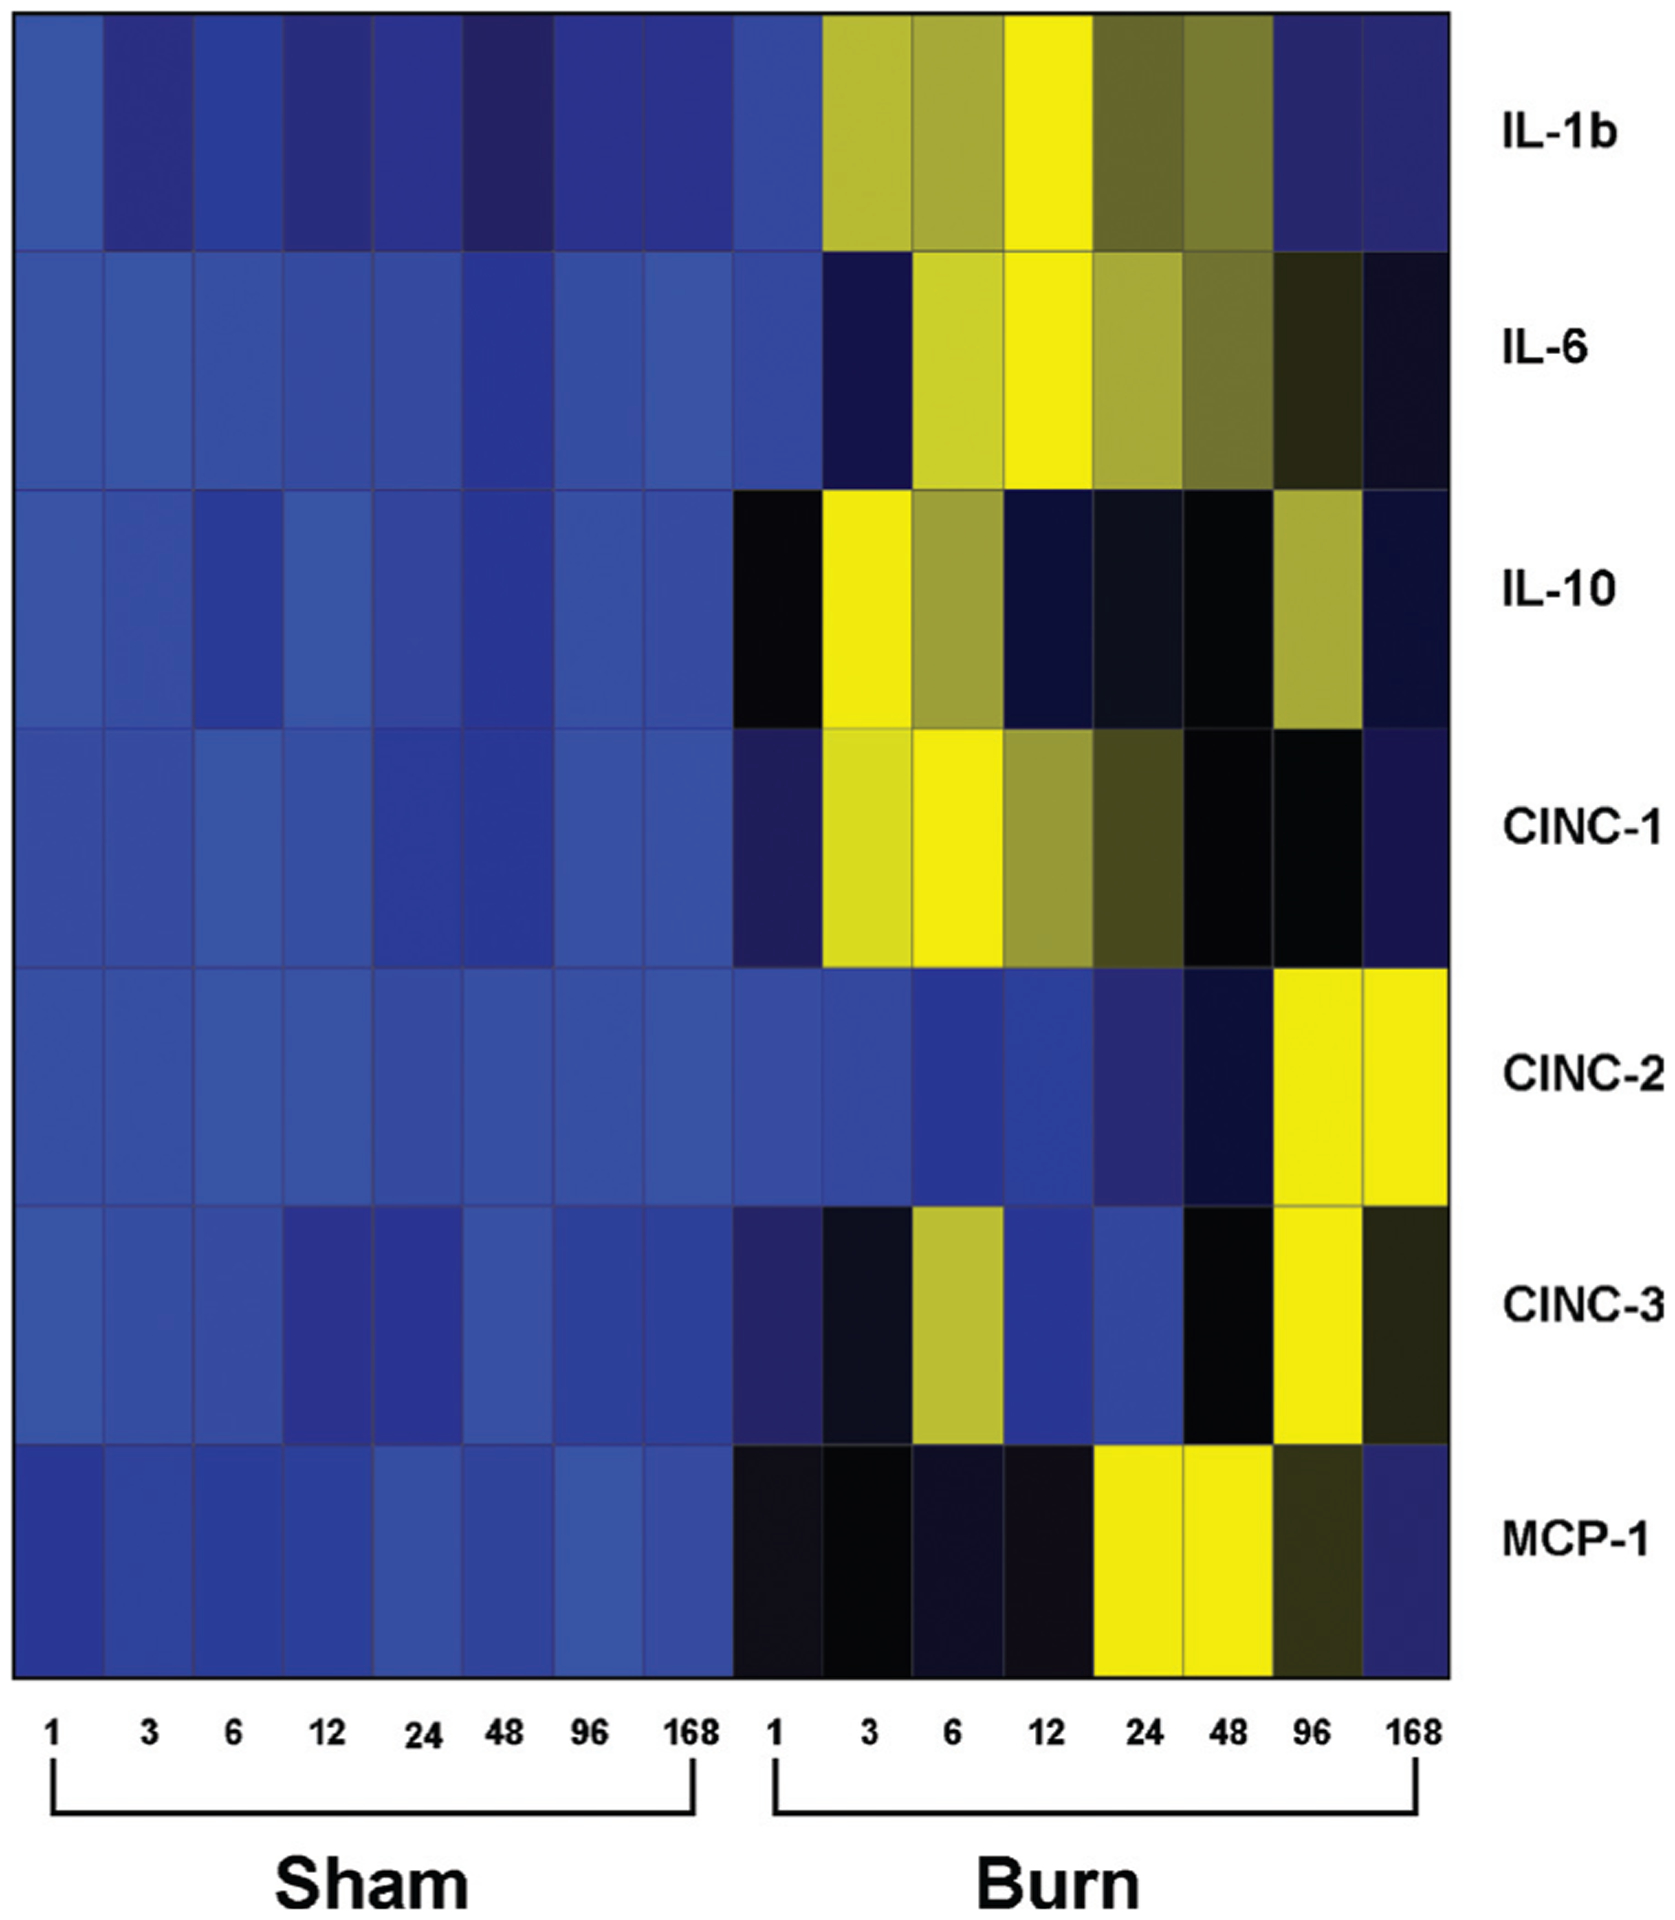
Values (average cytokine concentration; picograms per milliliter), with blue indicating lowest levels, yellow indicating highest levels, and black in the middle. Gray squares indicate that no expression was detected.