
Figure 1.
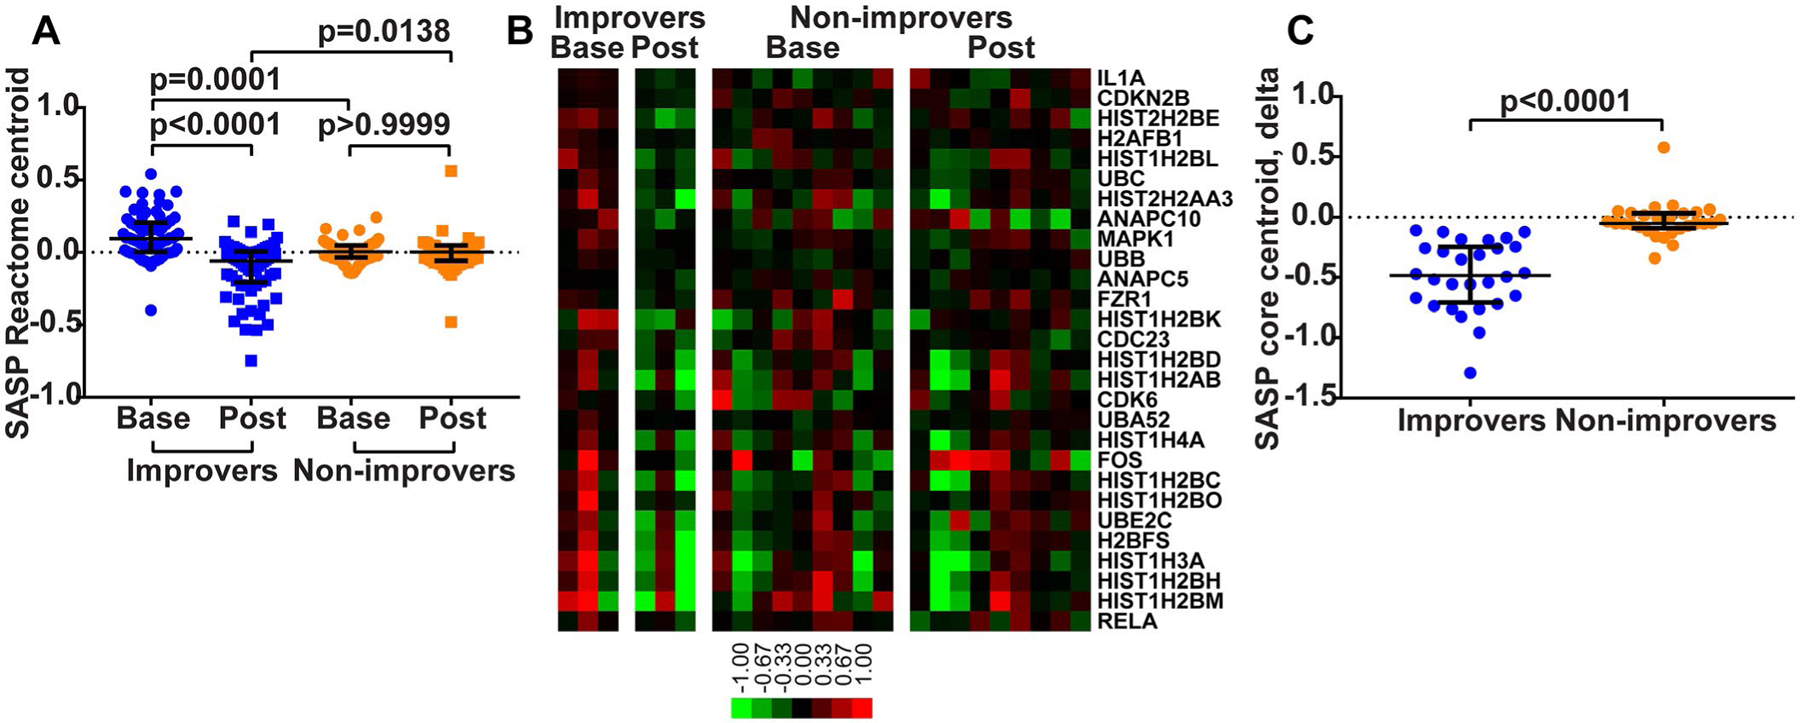
Skin senescence-associated secretory phenotype (SASP) gene signature across dasatinib improvers and non-improvers. A, Centroids of genes in the Reactome SASP gene set, created by averaging expression values for component genes across baseline (base) and posttreatment (post) biopsy samples from improvers and non-improvers. P values were determined by Kruskal-Wallis test with Dunn’s multiple comparison test. B, Gene expression heatmap of 28 SASP pathway genes that significantly contributed to SASP enrichment in baseline biopsy samples from improvers. Genes are ordered by rank metric score (i.e., IL1A was the largest contributor to SASP enrichment). Color bar shows the log2-transformed median-centered fold change represented by each color in the heatmap. C, Comparison of the degree of change (calculated as posttreatment minus baseline expression level) for 28 SASP pathway core enrichment genes between improvers and non-improvers. P value was determined by Mann-Whitney test. In A and C, each symbol represents a specific gene; bars show the median and interquartile range.