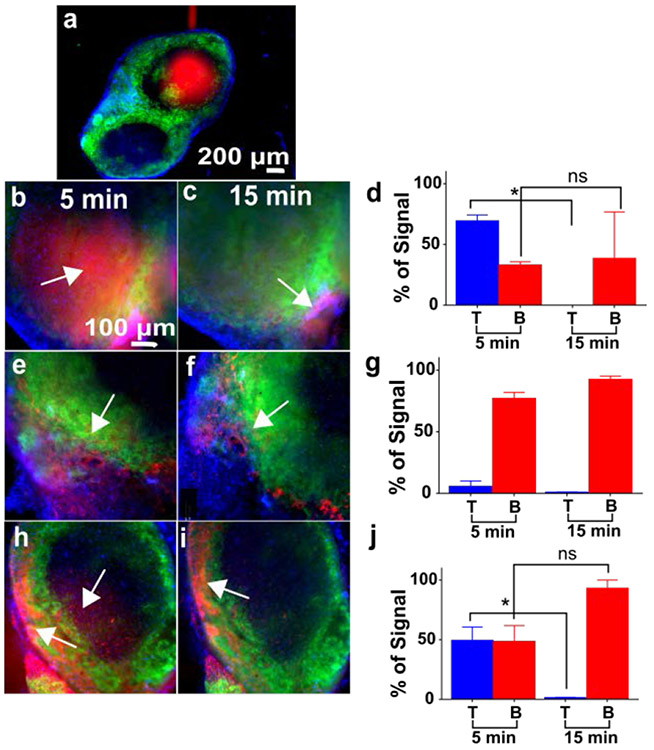
Figure 6:
Local stimulation of the T-cell and B-cell regions of lymph node slices on-chip. Live slices were stained with FITC-anti-mouse B220 (green) and Hoechst (blue) to identify B-cell zones. a) Representative delivery of Alexa Fluor-647-Glucose-BSA (red) to the T-cell zone. Representative images collected 5 min and 15 min after delivery to the T-cell zone (b, c), B-cell zone (e, f), and the intersection of the two zones (h, i). All images shown with equal scaling of intensities. Graphs show the average percent of total glucose-BSA signal that was located in each zone, 5 and 15 minutes after delivery. d) Percent signal in the T cell zone dropped significantly by 15 min after delivery there (paired t-test, p<0.05, n = 2). g) Percent signal in the B-cell zone remained high after delivery there (n = 3). j) After delivery to the T/B interface, percent signal in the T cell zone dropped significantly by 15 min (paired t-test, p<0.05, n = 3), but not in the B cell zone. Values are mean ± SEM.

