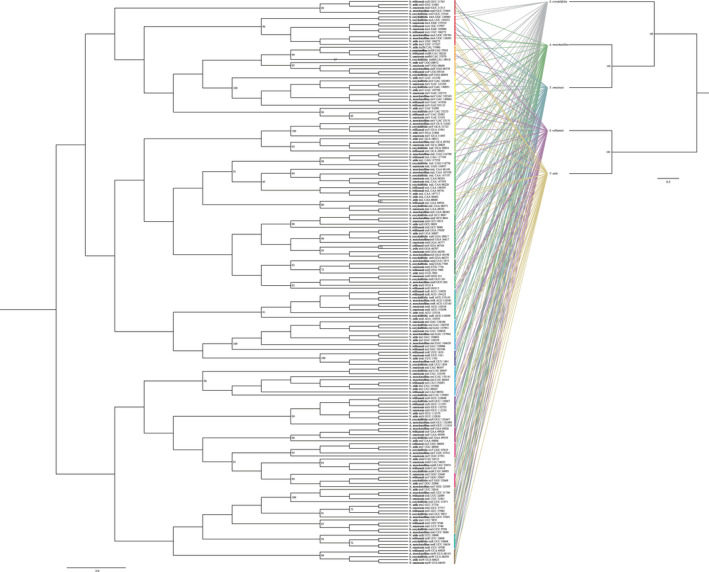
FIGURE 6.

Gene tree based on 185 chloroplast tRNA genes and species tree based on chloroplast genomes (being removed of tRNA sequences). ML bootstrap values ≥65% are given adjacent to nodes. Bars next to the tRNA gene tree are colored based on different tRNA isotypes. Grayish lines connecting two trees show the positions of tRNA on species tree
