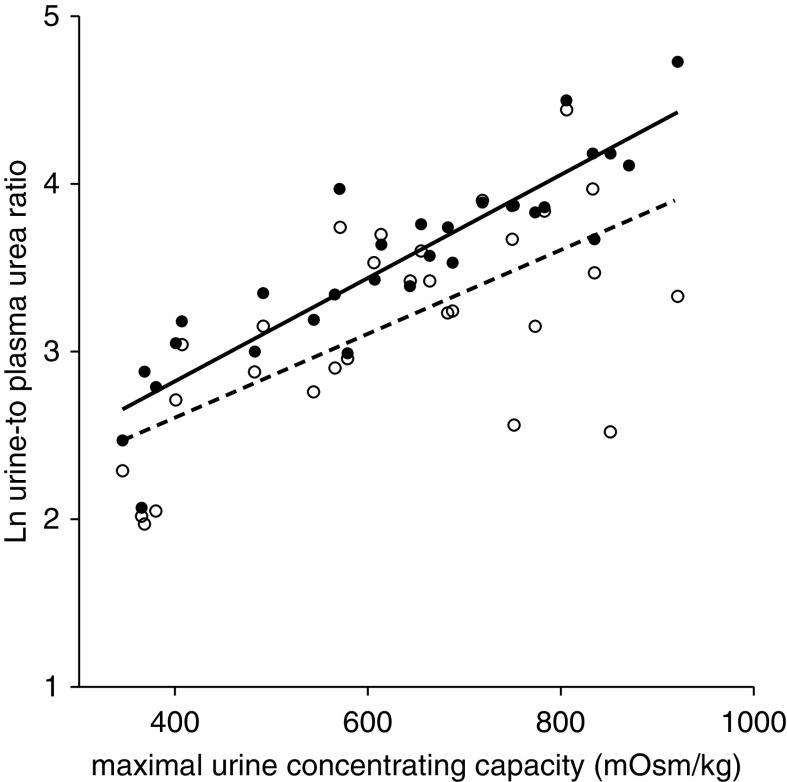
Figure 2.
Correlation of natural log (ln)-transformed urine-to-plasma urea ratio with maximal urine-concentrating capacity during prolonged water deprivation tests in 30 patients with ADPKD. Solid circles represent the urine-to-plasma urea ratio calculated from early morning fasting urine samples (R=0.90; P<0.001); open circles represent the urine-to-plasma urea ratio from unstandardized urine samples (R=0.67; P<0.001).

