Figure 5.

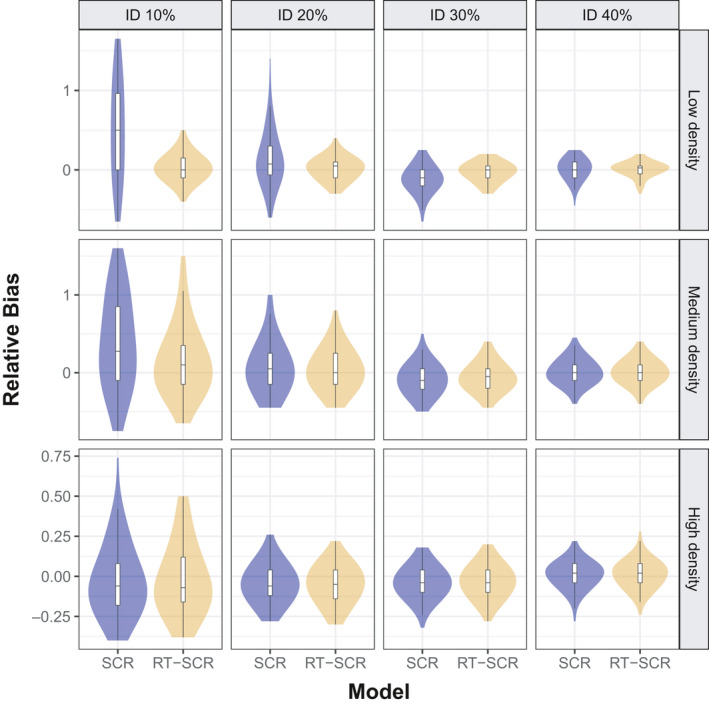
Violin plot of relative bias from population size estimates ( in three levels of density ( using standard SCR (light blue) and random thinning SCR (light gold) models for four levels of identification rate ( {10%, 20%, 30%, 40%})

Violin plot of relative bias from population size estimates ( in three levels of density ( using standard SCR (light blue) and random thinning SCR (light gold) models for four levels of identification rate ( {10%, 20%, 30%, 40%})