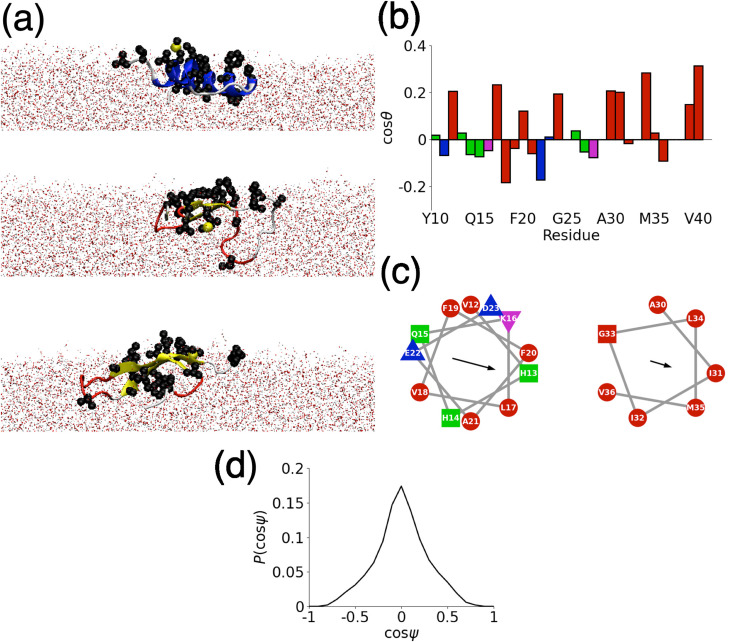
FIG. 3.
A(10–40) structure at the AWI. (a) Representative simulation snapshots, corresponding to the most common probable structures from cluster analysis. Hydrophobic side chains are highlighted as van der Waals (VDW) spheres. (b) Side chain orientation. Red, green, blue, and magenta denote hydrophobic, polar, negatively-charged, and positively charged residues, respectively. (c) Helical wheel plots for -helical regions (V12-D23 and A30-V36). Colors as in (b). (d) Probability histogram of helix orientation relative to AWI ().

