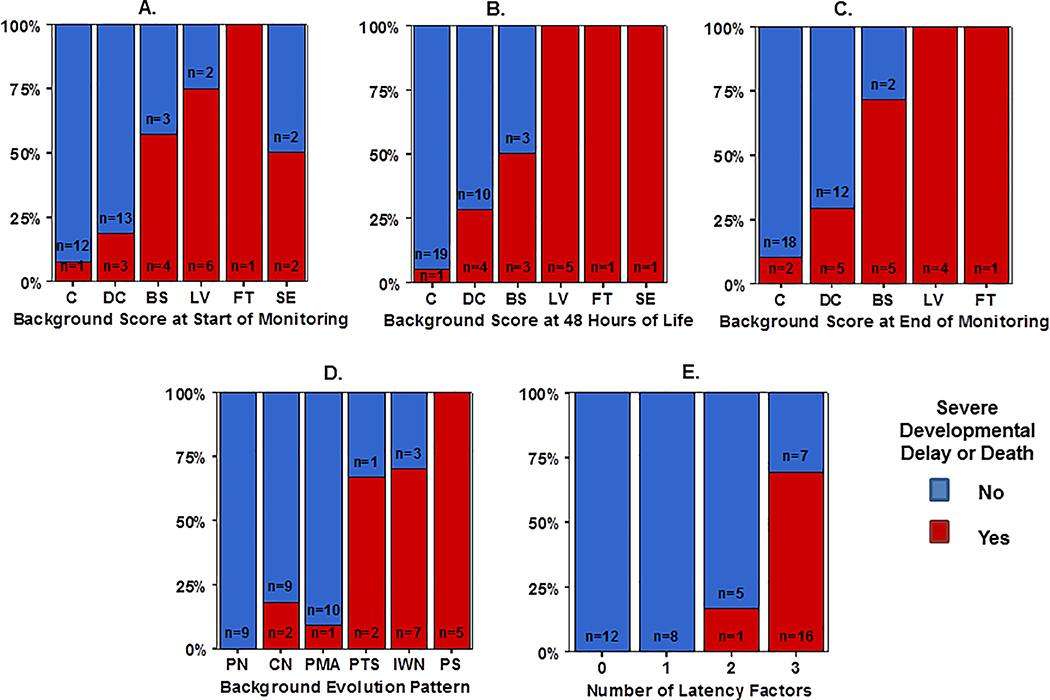
Figure 3:
Distribution of aEEG background pattern at the (A) start of monitoring, (B) 48 HOL, and (C) end of monitoring compared with overall aEEG background evolution classification (D), stratified by outcome group defined as death or significant developmental delay (red bar) or survived with normal development (blue bar). (E) Comparison of favorable versus adverse outcome frequency based on number of latency factors (0=TTDC, TTC, TTN all below cut point, 1–2 factors beyond cut point, or 3= TTDC, TTC, TTN all beyond cut point).

