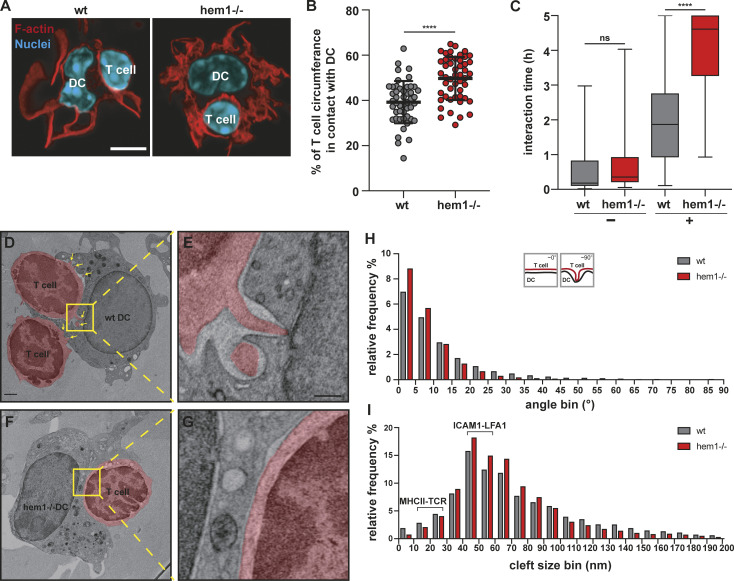
Figure 4.
Hem1−/− DCs alter synapse structure and dynamics. (A) Fluorescence microscopy images of synapses formed between mature WT or hem1−/− DCs and T cells stained with phalloidin and DAPI. Scale bar: 5 µm. (B) Percentages of T cell surface area in contact with DC, ∼50 cells each, t test, mean ± SD, three biological replicates. (C) Interaction times of mature WT or hem1−/− DCs with T cells in the absence (−) or presence (+) of OVA323-339 peptide, n = 50 contacts each for (+) or n = 30 contacts each for (−), Mann-Whitney test, mean ± min/max, three biological replicates. (D and E) EM of WT DC–T cell synapse, T cells are colored in red, yellow box and dotted lines denote region magnified in E, yellow arrows highlight T cell protrusions. (F and G) EM of hem1−/− DC–T cell synapse, T cell is colored in red, yellow box and dotted lines denote region magnified in G. Scale bars: 1 µm in D and F, 300 nm in E and G. (H) Frequency histograms in percent of the angles found between DC and T cell membranes, n = 4 synapses each, two biological replicates, Kolmogorov-Smirnov test, P ≤ 0.0001. (I) Frequency histograms in percent of the cleft size found between DC and T cell membranes from H, Kolmogorov-Smirnov test, P ≤ 0.0001. ns, not significant. ****, P ≤ 0.0001.

