Figure 6.
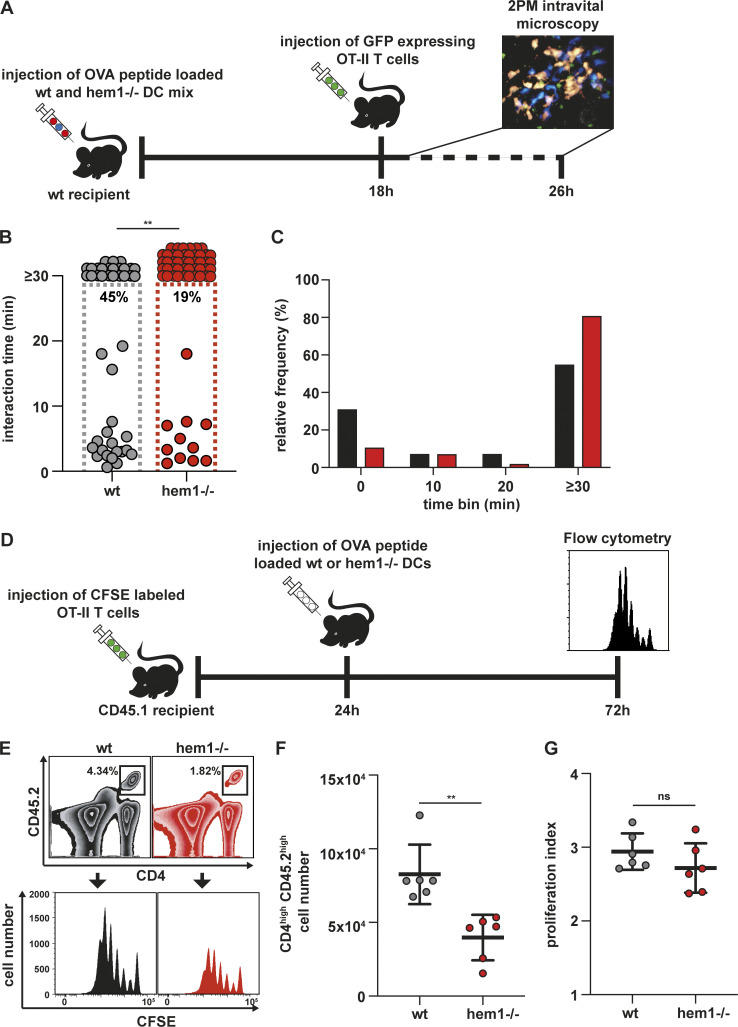
Hem1−/− DCs have T cell priming defects in vivo. (A) Schematic overview of experimental setup for two-photon intravital microscopy. (B) In vivo interaction times of mature WT or hem1−/− DCs and T cells, n = 45 cell–cell interactions each, Mann-Whitney test. Percentages refer to cell–cell interactions that start and end within the 30-min time window, two biological replicates. (C) Frequency histograms in percent of DC–T cell interaction times from B. (D) Schematic overview of experimental setup for in vivo T cell proliferation assays. (E) Gating strategy to determine the CFSE proliferation profiles of CD45.2/CD4 T cells in CD45.1 mice after WT or hem1−/− DC T cell priming. (F) Absolute CD45.2/CD4 T cell numbers in the popliteal lymph nodes of CD45.1 mice 72 h after DC injections, n = 6 lymph nodes each, Mann-Whitney test, two biological replicates. (G) Proliferation indices of CFSE-labeled T cells from F, t test. ns, not significant. **, P ≤ 0.01.

