Figure S2.
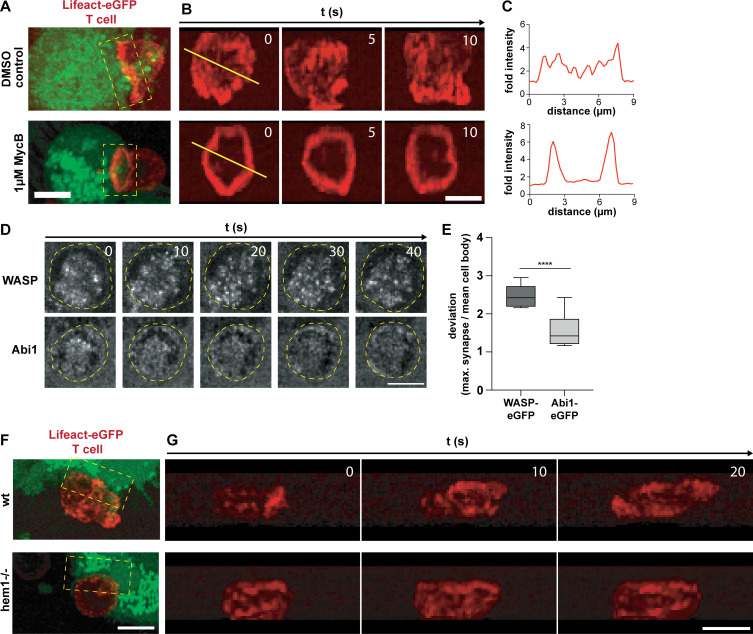
Characterization of the structure and dynamics of the DC and T cell actin cytoskeleton at the immunological synapse. (A) 3D projection of Lifeact-eGFP–expressing OT-II T cells (red), interacting with DMSO control (upper) or 1 µM MycB–treated (lower) and 5-Carboxytetramethylrhodamine (TAMRA)-stained mature DC (green). (B) En face time-lapse reconstruction of T cell synapses shown in A (yellow boxes). (C) Relative Lifeact-eGFP intensities along yellow lines shown in B. (D) Time-lapse series of synapses formed between WASP-eGFP (upper) or eGFP-Abi1 (lower) expressing mature WT DCs and OT-II T cells in confiner setup. Yellow ovals demarcate the outline of the T cell. Scale bar: 5 µm. (E) Deviation of maximum WASP-eGFP or Abi1-eGFP signal at the synapse from mean intensity in the cell body, n = 7 synapses for each reporter construct, t test. (F) 3D projection of Lifeact-eGFP–expressing OT-II T cells (red) interacting with WT (top) or hem1−/− (bottom) TAMRA-stained mature DCs (green). (G) En face time-lapse reconstruction of T cell synapses shown in F (yellow boxes). All scale bars: 5 µm. ****, P ≤ 0.0001.

