Figure 4.
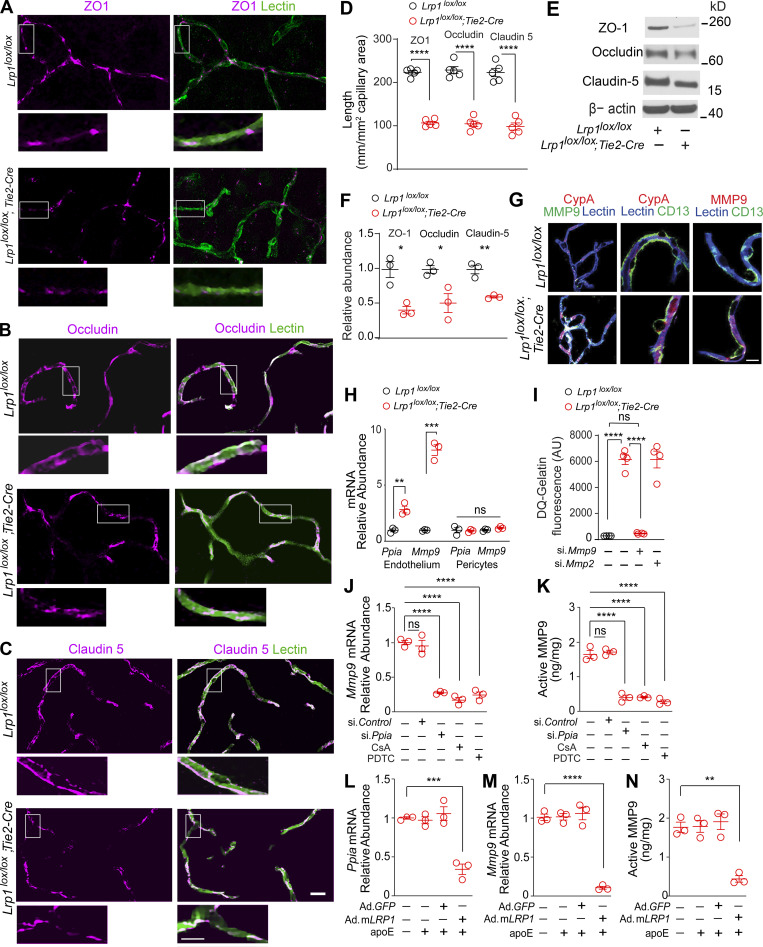
Activation of CypA-MMP9 pathway after Lrp1 endothelial loss. (A–D) ZO-1 (A, purple), occludin (B, purple), and claudin 5 (C, purple) colocalization with endothelial lectin (green) in the cortex of 2-mo-old Lrp1lox/lox; Tie2-Cre mice and Lrp1lox/lox controls, and quantification of ZO-1, occludin, and claudin 5 length on lectin+ endothelial profiles in these mice (D). Scale bar = 25 µm. Boxes in A–C are sites taken for higher magnification insets shown below single and merged images, scale bar = 10 µm. Mean ± SEM, n = 5 mice/group. (E and F) Immunoblotting for ZO-1, occludin, and claudin 5 in brain capillaries (E) and their relative abundance compared with β-actin (F) in Lrp1lox/lox; Tie2-Cre and Lrp1lox/lox mice. Mean ± SEM, n = 3 mice/group. β-actin, loading control. (G) CypA, MMP9, and lectin+ endothelium (left: purple, CypA and lectin; white, MMP9 and lectin); CypA, lectin+ endothelium, and CD13+ pericytes (middle: purple, CypA and lectin), and MMP9, lectin+ endothelium, and CD13+ pericytes (right: purple, MMP9 and lectin) in brain capillaries from Lrp1lox/lox; Tie2-Cre and Lrp1lox/lox mice. Scale bar = 10 µm. (H) Ppia and Mmp9 mRNA relative abundance normalized to Gapdh (housekeeping gene) in brain endothelial cells and pericytes from Lrp1lox/lox; Tie2-Cre and Lrp1lox/lox mice. Mean ± SEM, n = 5 isolates/group. (I) Gelatinase activity in brain endothelial cell medium from Lrp1lox/lox and Lrp1lox/lox; Tie2-Cre mice with or without siMmp9 or siMmp2. AU, arbitrary units. Mean ± SEM, n = 4 isolates/group. (J and K) Inhibition of Mmp9 mRNA (J) and activated MMP9 (K) by CypA silencing (si.Ppia), the CypA inhibitor cyclosporine A (CsA; 42 nM), and the NF-κB inhibitor PDTC (20 µM) in brain endothelial cells from Lrp1lox/lox; Tie2-Cre mice. (L–N) Inhibition of Ppia mRNA (L), Mmp9 mRNA (M), and active MMP9 (N) in brain endothelial cells from Lrp1lox/lox; Tie2-Cre mice after adenoviral LRP1 (Ad.mLRP1) reexpression in the presence of astrocyte-derived murine apoE (40 nM). AdGFP, control. Mean ± SEM, n = 3 isolates/group. All mice were 2 mo old. In D and F, significance was determined by Student’s t test. In H–N, significance was determined by one-way ANOVA followed by Bonferroni post hoc test. ns, not significant; *, P < 0.05; **, P < 0.01; ***, P < 0.001; ****, P < 0.0001.

