Figure S2.
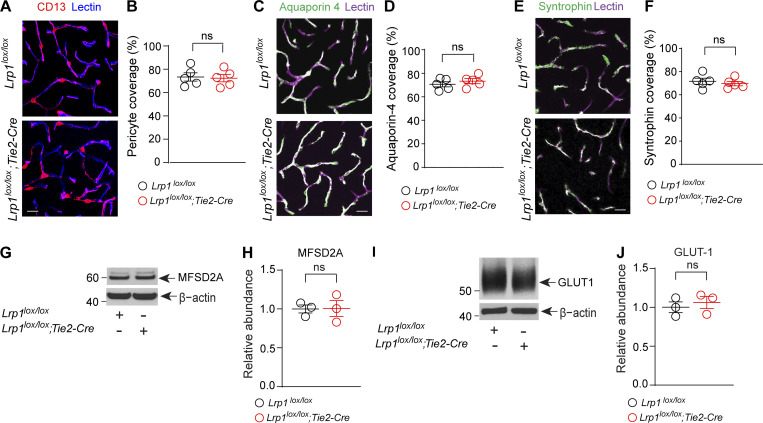
Additional characterization of Lrp1lox/lox; Tie2-Cre mice. (A and B) Representative confocal microscopy images of CD13+ pericytes (magenta) and lectin+ endothelium (blue) in the cortex of 4-mo-old Lrp1lox/lox; Tie2-Cre and Lrp1lox/lox littermate control mice (A), and quantification of pericyte coverage of brain capillary (<6 µm in diameter) lectin+ endothelial profiles (B). Scale bar = 25 µm. Mean ± SEM, n = 5 mice/group. (C and D) Representative confocal images of aquaporin 4+ astrocyte endfeet (green) and lectin+ endothelium (purple) in the cortex of 4-mo-old Lrp1lox/lox; Tie2-Cre and Lrp1lox/lox littermate control mice (C) and quantification of astrocytic endfeet aquaporin 4+ coverage of brain capillary (<6 µm in diameter) lectin+ endothelial profiles (D). Scale bar = 25 µm. Mean ± SEM, n = 5 mice/group. (E and F) Representative confocal images of α-syntrophin+ astrocytic endfeet (green) and lectin+ endothelium (purple) in the cortex of 4-mo-old Lrp1lox/lox; Tie2-Cre and Lrp1lox/lox littermate control mice (E) and quantification of astrocytic endfeet α-syntrophin+ coverage of brain capillary (<6 µm in diameter) lectin+ endothelial profiles (F). Scale bar = 25 µm. Mean ± SEM, n = 5 mice per group. (G and H) Immunoblotting (G) and relative abundance of endothelial major facilitator superfamily domain–containing protein 2 (MSFD2a) using β-actin as a loading control (H) in isolated brain microvessels from 4-mo-old Lrp1lox/lox; Tie2-Cre mice and Lrp1lox/lox littermate controls. (I and J) Immunoblotting (I) and relative abundance of endothelial glucose transporter 1 (GLUT1) using β-actin as a loading control (J) in isolated brain microvessels from 4-mo-old Lrp1lox/lox; Tie2-Cre mice and Lrp1lox/lox littermate controls. In H and J, mean ± SEM, n = 3 mice per group. In B, D, F, H, and J, ns, nonsignificant by Student’s t test.

