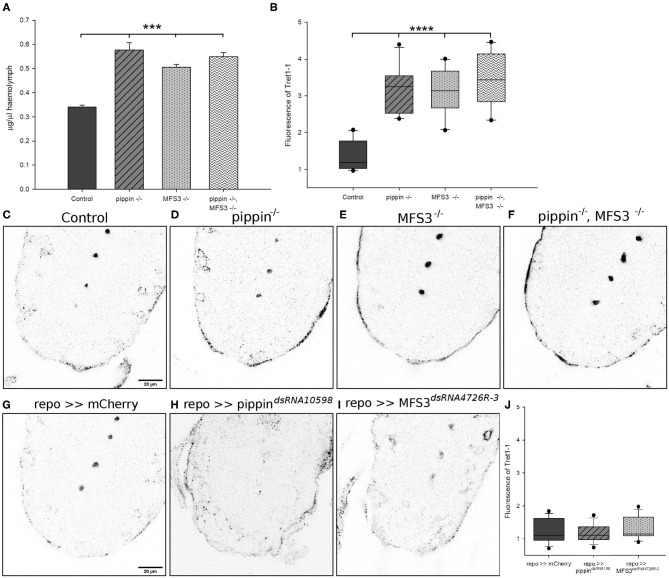
Figure 4.
Compensatory increase in circulating carbohydrate levels and upregulation of Tret1-1 upon loss of Pippin or MFS3. (A) Glucose levels in the hemolymph of adult flies were analyzed. Both single and double pippin−/− and Mfs3−/− mutants show an increase in circulating glucose levels. N = 3; ***p ≤ 0.001. (B–J) L3 larval brains of null mutants or panglial knockdown of pippin and Mfs3 (repo-Gal4> CG4797dsRNA10598; repo-Gal4>MFS3dsRNA4726R-3) were dissected and stained for Tret1-1 expression. (B) Quantification shows the difference in Tret1-1 fluorescence between controls and null mutants. N ≥ 4; n = 10–12; ****p ≤ 0.0001. (C) Control animals show wildtype levels of Tret1-1 in the brain. (D) pippin−/− mutants (E), Mfs3−/− mutants (F), and pippin−/−, Mfs3−/− double mutants show a strong upregulation in Tret1-1 expression in perineurial glial cells. (G) repo>>mCherrydsRNA serves as a control for panglial knockdown of pippin and Mfs3 by RNA interference. repo>>mCherrydsRNA animals show wildtypic levels of Tret1-1. (H) Glia-specific knockdown of pippin (repo>>CG4797dsRNA10598). No increase in Tret1-1 levels can be found. (I) Glia-specific knockdown of Mfs3 (repo>>MFS3dsRNA4726R-3). No increase in Tret1-1 levels can be seen. (J) Quantification of Tret1-1 fluorescence of pan glial knockdown of mCherry, pippin or Mfs3. N ≥ 4; n = 14–15.

