Figure 5.
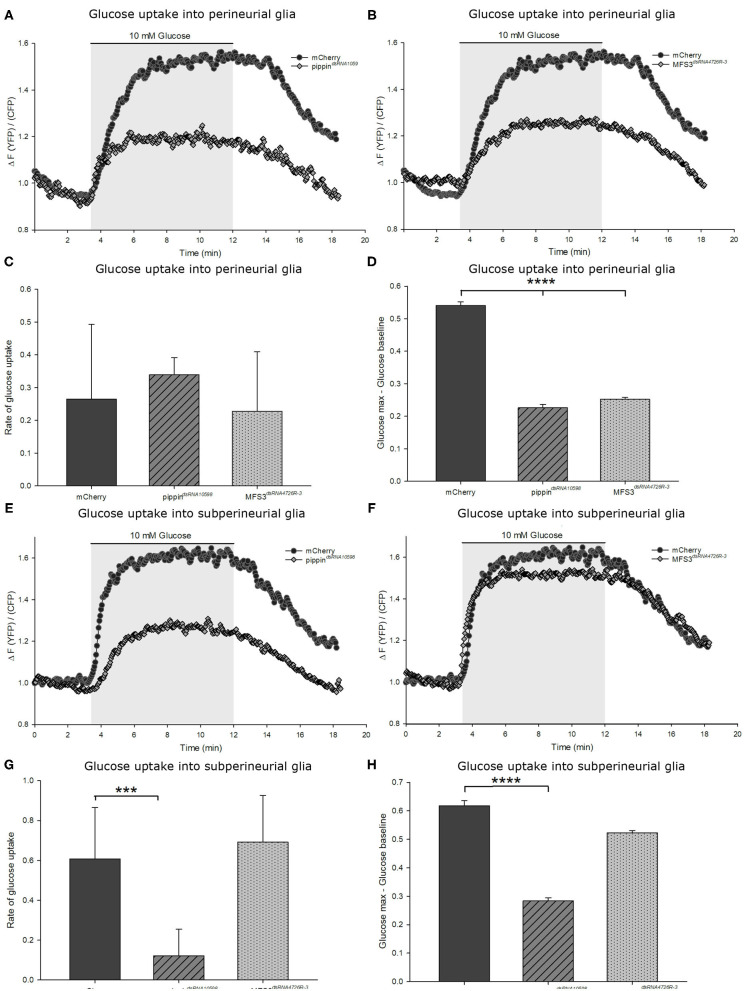
Pippin and MFS3 facilitate glucose uptake into the Drosophila BBB-forming cells. Glucose uptake was measure in ex vivo L3 larval brains expressing a genetically encoded glucose sensor (FLII12Pglu-700μδ6). (A,B) Example traces of brains with a perineurial knockdown of pippin (apt-Gal4>pippindsRNA10598) (A) or Mfs3 (apt-Gal4>MFS3dsRNA4726R-3) (B), where the glucose sensor is expressed in the perineural glial cells. (C) Quantification of the rate of glucose uptake. The glucose uptake rate as calculated by the steepness of the slope shows no difference between transporter knockdown and control brains. (D) Quantification of the maximum glucose concentration in the cells. Shown is the difference between the maximum glucose concentration and the baseline glucose concentration. N = 8–12; ****p ≤ 0.0001. (E–H) Glucose uptake into the subperineurial glial cells. (E) moody-gal4>pippindsRNA10598 brains show a reduction in the uptake rate and overall levels of glucose entering the subperineurial glia. (F) moody-Gal4>Mfs3dsRNA4726R-3 brains show no difference in glucose uptake rate or maximum glucose levels. (G,H) Quantification of the glucose uptake rate and the maximum glucose concentrations reached in the subperineurial glial cells. (G) Rate of glucose uptake into the subperineurial glial cells in brains of the different genotypes (subperineurial glial knockdown). Knockdown of pippin in the subperineurial glial cells severely reduces glucose uptake rates. (H) Maximum glucose levels in subperineurial glial cells expressing FLII12Pglu-700μδ6. Brains in which pippin is knocked down in the subperineurial glial cells show a lower maximum glucose level than control brains or Mfs3 knockdown brains..n = 8–12; ***p ≤ 0.001, ****p ≤ 0.0001. Error bars show standard deviation.

