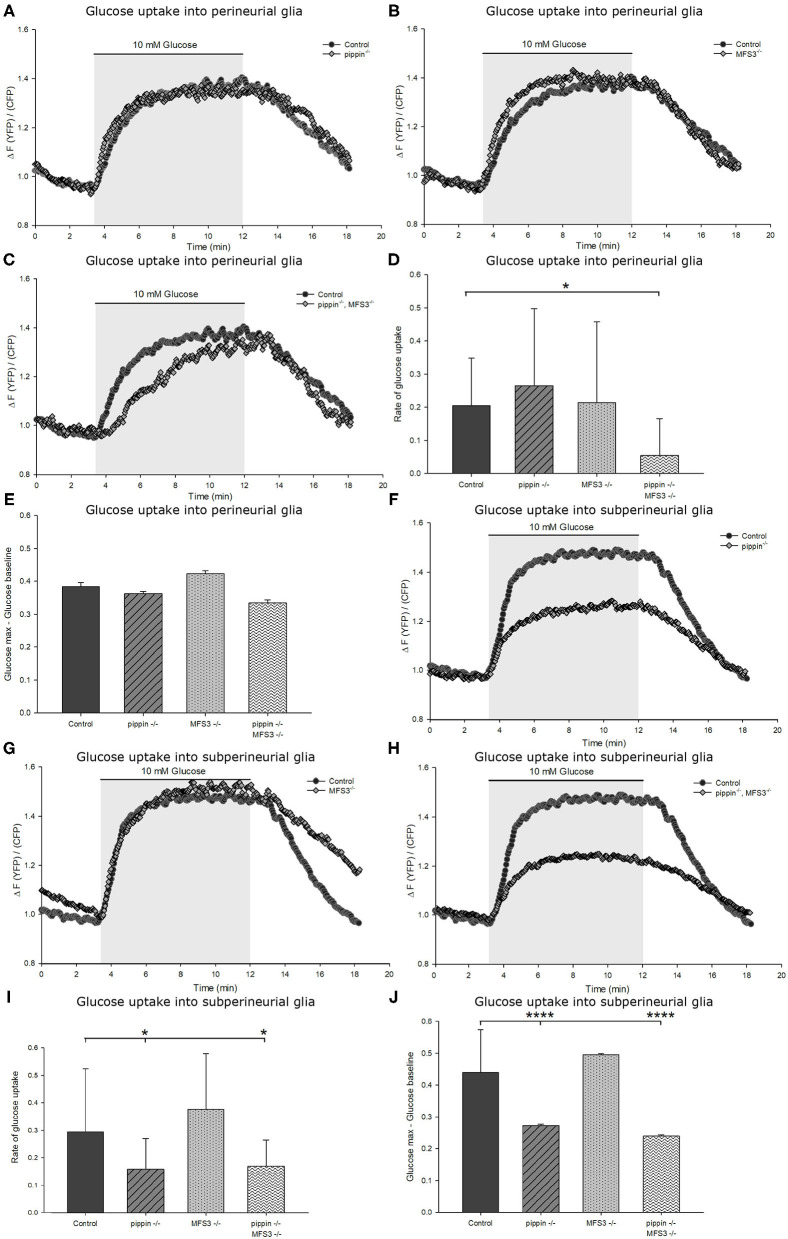
Figure 6.
Compensatory upregulation rescues deficits in carbohydrate uptake caused by loss of Pippin and MFS3. (A–E) Capacity of glucose uptake in ex vivo larval brains of pippin−/− or Mfs3−/− null single or double mutants expressing FLII12Pglu-700μδ6 in the perineurial glial cells. There is no difference observed in glucose uptake rate or maximum glucose concentration compared to control brains for pippin−/− (A) or Mfs3−/− (B) single mutants. However, the double mutant (C) perineurial glial cells take up glucose significantly slower than single mutants or wildtype controls. (D) Quantification of the glucose uptake rate into perineurial glial cells in the indicated genotypes. The double mutant perineurial glial cells take up glucose significantly slower than single mutants or wildtype controls. n = 8–12; *p ≤ 0.05. (E) Quantification of the difference between maximum glucose concentration and baseline glucose concentration. There is no observable difference between the genotypes. n = 8–12. (F–J) Glucose uptake and maximum glucose level in the subperineurial glial cells. (F) pippin−/− mutant brains, but not Mfs3−/− mutant brains (G) show reduced glucose uptake into the subperineurial glial cells. (H) pippin−/−, MFS3−/− double mutant brains show the same phenotype as pippin−/− single mutant brains. Both the rate of glucose uptake (I) and the maximum glucose concentration (J) are reduced in both pippin−/− single and pippin−/−, MFS3−/− double mutant brains. n = 8–12; *p ≤ 0.05, ****p ≤ 0.0001. Error bars show standard deviation.

