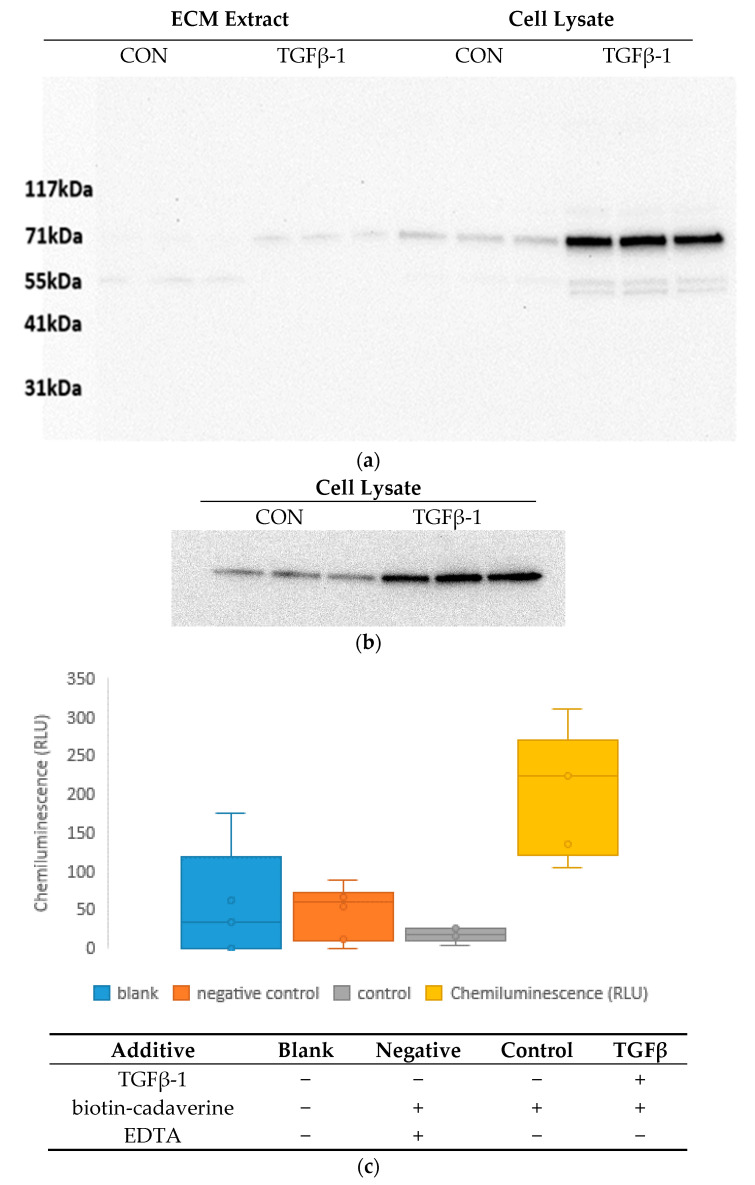
Figure 3.
TG2 activity and Western blot analysis of decellularised control and TGFβ-1-treated cell cultures. ECM and cell lysates prepared from control and TGFβ-1-treated cultures after 15 days of incubation (n = 3) were immunoblotted with antibodies to TG2 (expected molecular weight 77 kDa) (a) and GAPDH (b). Panel (c) depicts the datasets (excluding outliers) in a box and whisker plot. Activity assay data are presented in relative luminescent units (RLU) alongside with information about the medium composition in each condition. The presence and absence of the additives are marked with + and—, respectively.

