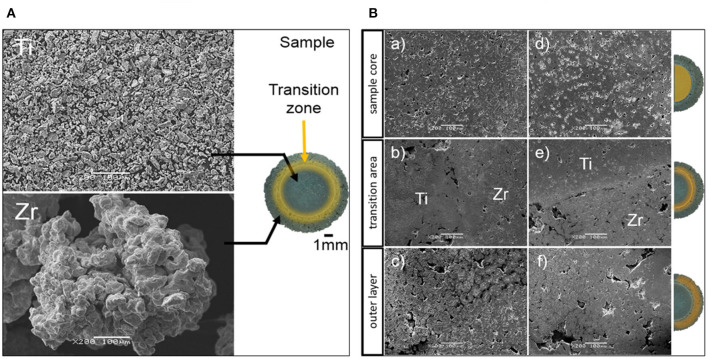
Figure 13.
(A) The SEM micrographs of initial powders and photo of the sample, including various zones across the sample; (B) the SEM micrographs of various zones: (a–c) Ti/Zr(–) produced under the pressure of 500 MPa; and (d–f) Ti/Zr(+) that was produced under 1,000 MPa pressure, reproduced with permission of (Matuła et al., 2020).

