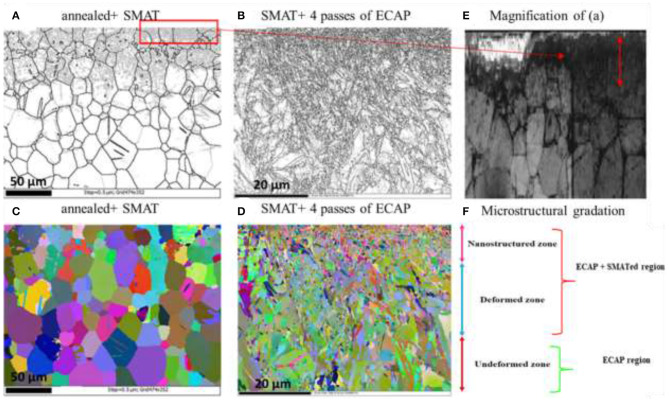
Figure 17.
The EBSD micrographs of Ti FGM with grain size gradation in cross-section; (A,C) the annealed+ SMATed sample; (B,D) SMAT+ 4 passes ECAPed sample (black and white images (A,B,E) are grain boundary maps, and colored images (C,D) are Euler maps; (E) the magnified image of (A); (F) shows the microstructural gradation in a cross-section of the SMAT+ECAP sample, reproduced with permission from Attarilar et al. (2019b).

