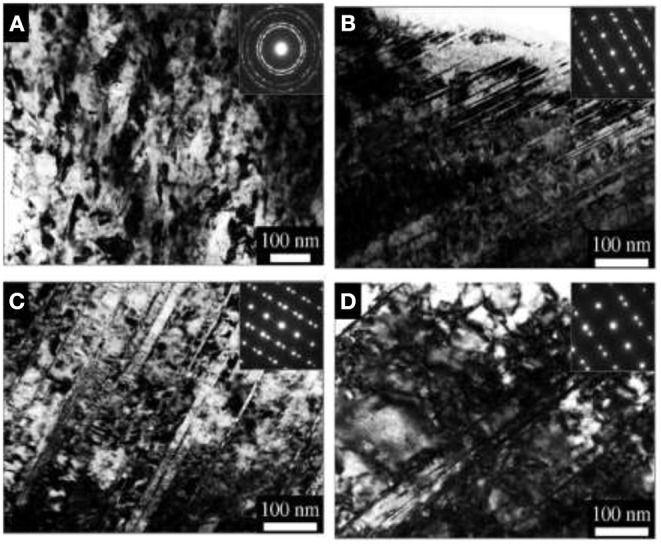
Figure 19.

The TEM cross-sectional micrographs of the SMGT Fe–Mn sample at different depths from the top surface. (A) ~10 μm; (B) 45 μm; (C) 188 μm; (D) 440 μm, inset pictures are the corresponding selected area electron diffraction patterns with permission from Wang et al. (2013).
