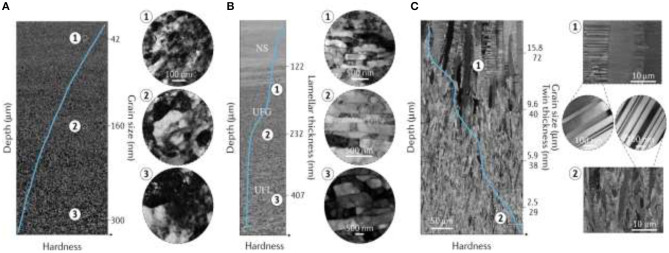
Figure 20.
(A) The SEM micrograph of gradient nanograined Cu confirming the grain size increase with depth with TEM micrographs from various depths. (B) The SEM micrograph showing the microstructure evolution in gradient nano-laminated Ni, including three distinct regions with nanostructures (NS), ultrafine-grained (UFG), and ultrafine-laminated (UFL) structures with depth increase along with TEM pictures from different depths. (C) SEM micrographs of the gradient nano-twinned structure in Cu confirming the reduction of grain size and twin thickness with depth along with TEM images of twin and grains at various depths. The solid blue lines inside SEM images present local hardness magnitude with respect to depth in the gradient layer. Image reused with permission from Li X. et al. (2020).

