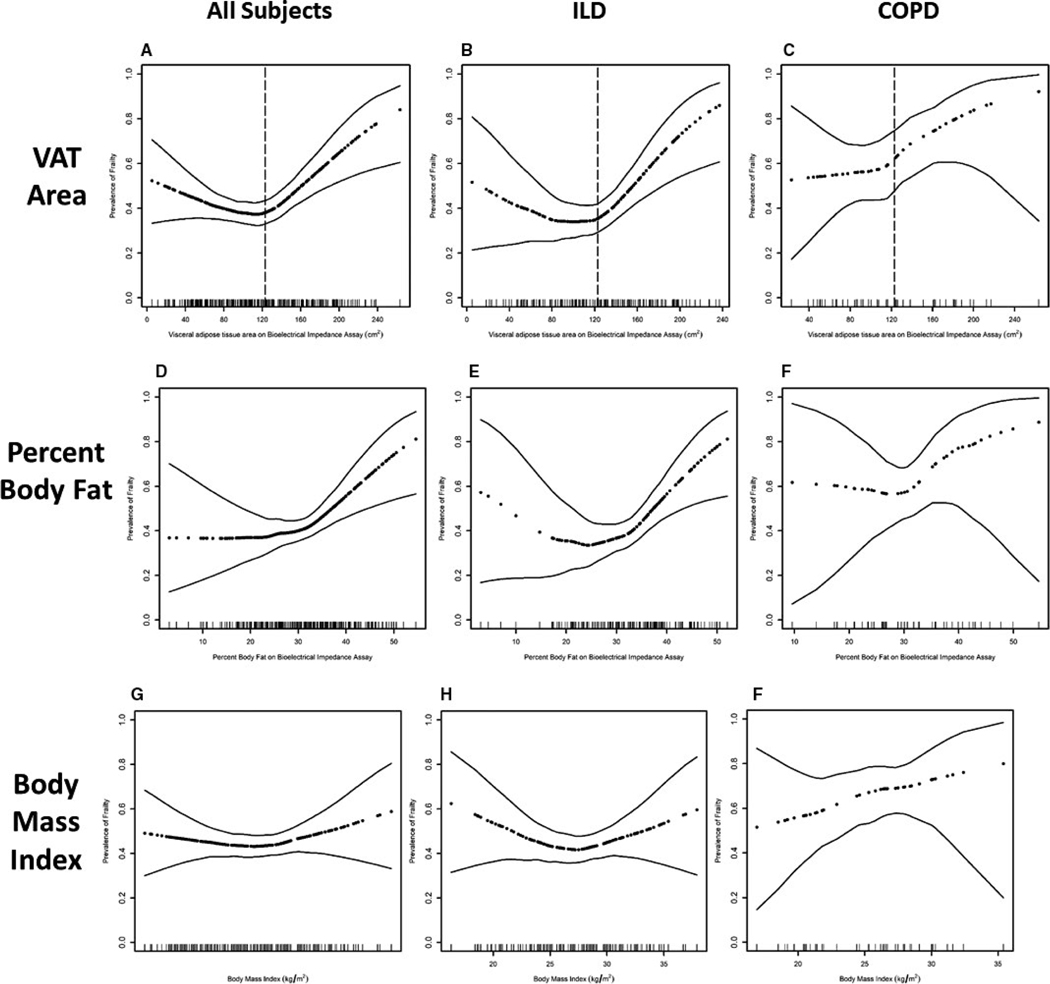
FIGURE 2.
Association between VAT area on BIA and frailty in (A) all subjects, (B) subjects with ILD, and (C) subjects with COPD with demonstration of visceral fat area cut-points as presented in primary analyses. Association between percent body fat on BIA and prevalence of frailty in (D) all subjects, (E) subjects with ILD, and (F) subjects with COPD. Associations between body mass index and prevalence of frailty in (G) all subjects, (H), subjects with ILD, and (I) subjects with COPD. Dark dotted black line represents the effect estimates. Surrounding thin lines represent 95% confidence bands. Each vertical line in the rug plot along the x axis represents a single study subject. Models of visceral fat and percent body fat are adjusted for age, sex, and body mass index. Models of BMI are adjusted for age and sex. Only 47 subjects with COPD are included in this cohort resulting in wide confidence intervals, caution should be used in interpreting results. ILD, interstitial lung disease; COPD, chronic obstructive pulmonary disease

