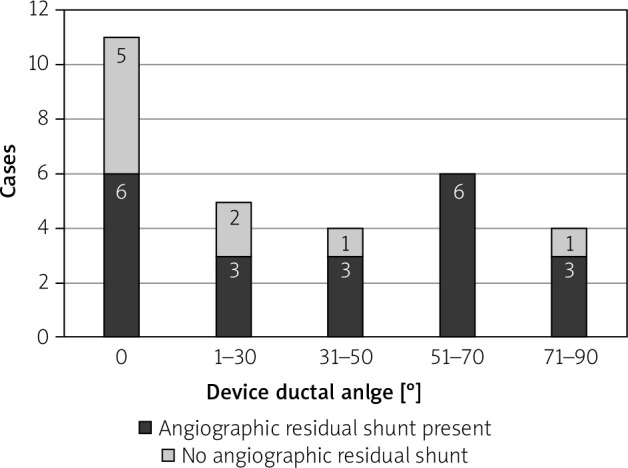
Figure 2.

Distribution of device-ductal angle in the Nit-Occlud group. X-axis shows the device-ductal angle in degrees and Y-axis represents the number of cases. The proportion of subjects with an angiographic residual shunt (black) and without an angiographic residual shunt (gray) are shown in the bar graphs
