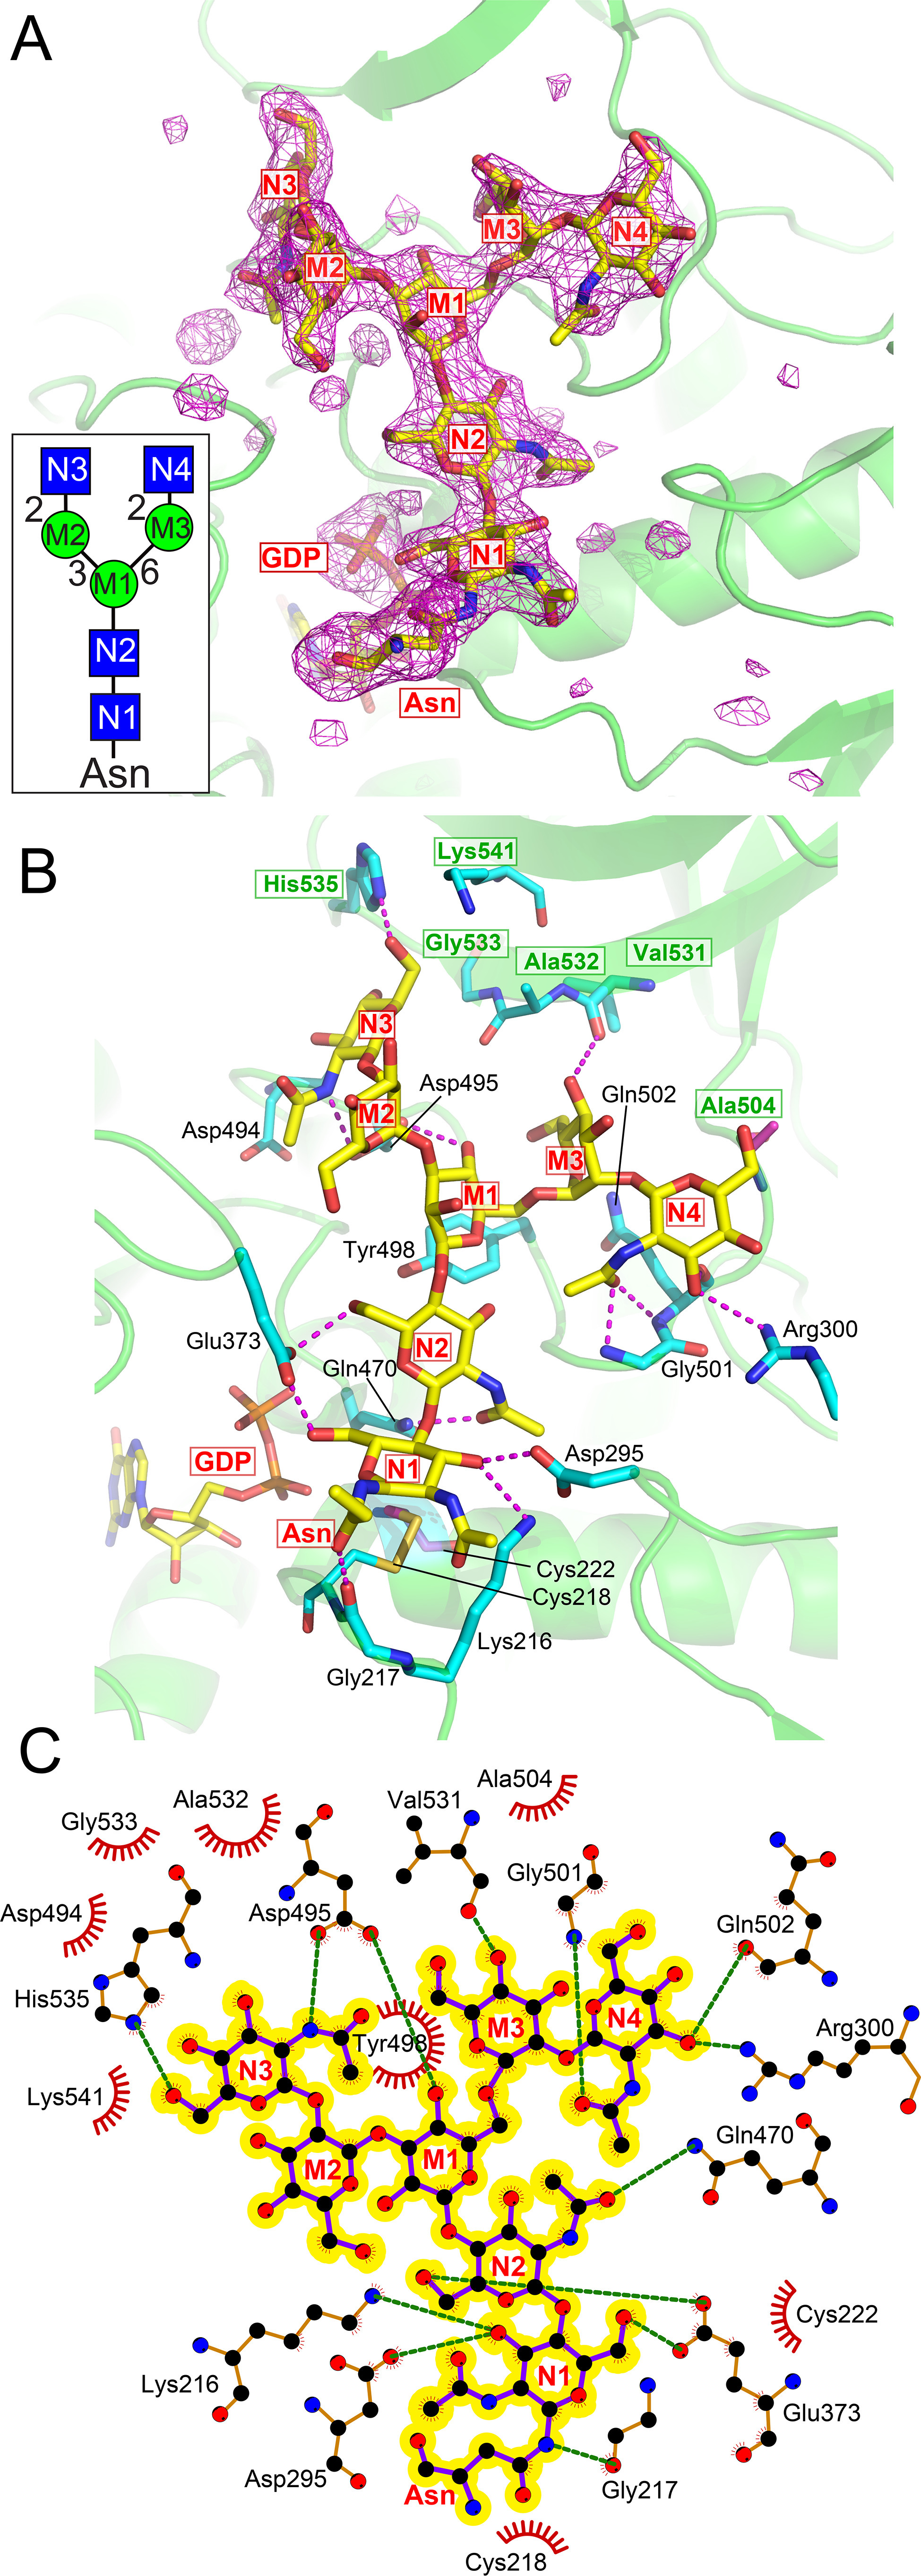
Figure 5.

FUT8 interactions with the A2 acceptor. A, the structure of the FUT8:A2-Asn acceptor complex is shown as a difference density map (Fo – Fc) of the acceptor contoured at 3.5 σ before modeling the GlcNAc2Man3GlcNAc2-Asn structure (yellow sticks). The inset shows a cartoon representation (see Fig. 2 for cartoon nomenclature) of the A2-Asn glycan with labeling of each monosaccharide inside each respective symbol and the corresponding labeling is also employed in the density map. B, the FUT8:A2-Asn complex is shown in yellow stick and cartoon representation with interacting residues shown in cyan stick representation and hydrogen bonds as magenta dashed lines. Monosaccharide residues of the A2-Asn structure are labeled as in Panel A. GDP is shown in yellow stick representation. Residues arising from the SH3 domain are indicated by green residue labeling enclosed in green boxes. C, Ligplot (117) representation depicting packing interactions (red, feathered lines) and hydrogen bonds (green, dashed lines) of A2-Asn (highlighted in yellow) in the FUT8 active site (orange ball and stick with atomic colors).
