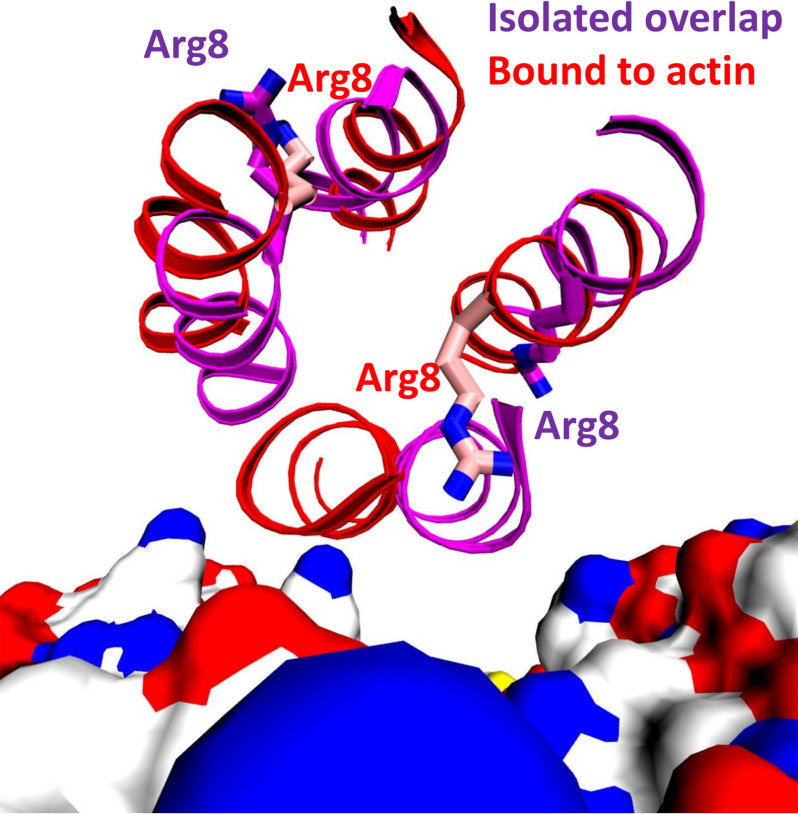
Figure 4.
Ribbon diagram of representative structures from the molecular dynamics simulations of actin with the M8R mutant (red) and the isolated M8R tropomyosin overlap (purple), viewed looking down the tropomyosin axis in the overlap domain. Actin is rendered as a surface-colored by element with carbon in white, oxygen in red, nitrogen in blue, and sulfur in yellow.

