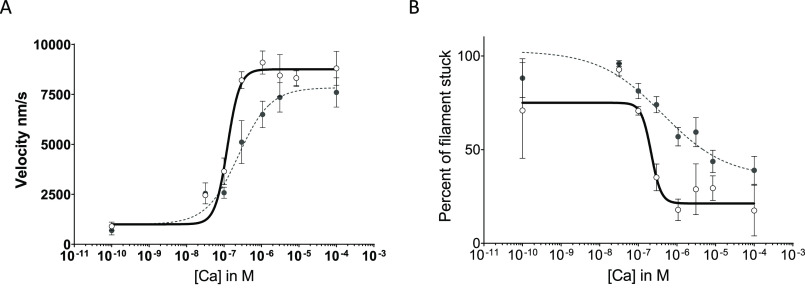
Figure 7.
In vitro motility of regulated filament actin on myosin. M8R is shown with filled circles and dotted lines. WT is shown with open circles and solid lines. A and B, velocity of top 5% of filaments (A) and percentage stuck of all filaments (B), each shown with four-parameter Hill fit equations. Each curve represents the average results of three separate experiments. Both cooperativity (nH: WT 2.64 ± 0.02 versus M8R 1.02 ± 0.01) and calcium sensitivity decreased (pCa50: WT 6.91 ± 0.01 versus M8R 6.62 ± 0.01).

