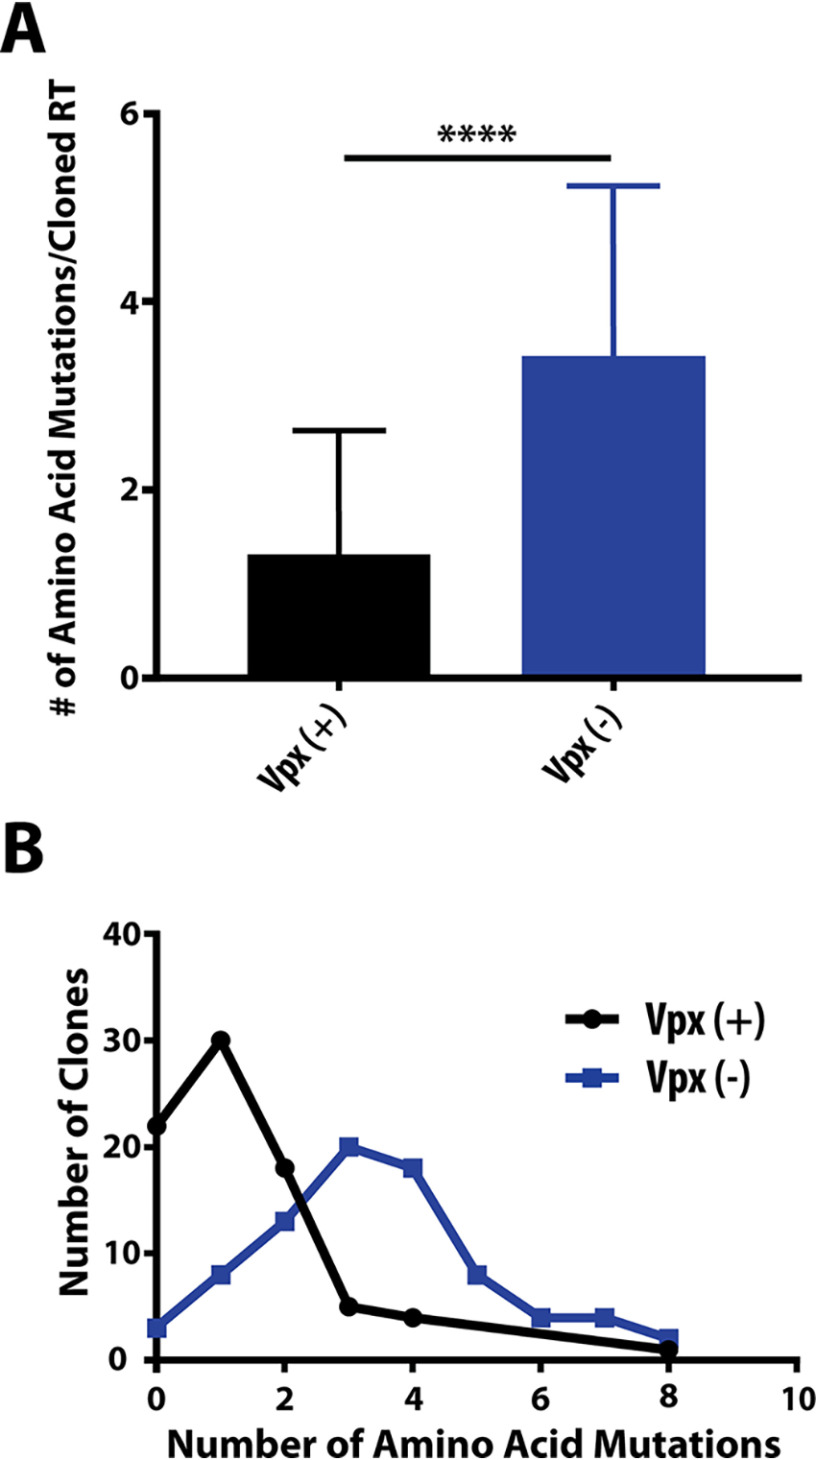
Figure 1.
Summary of amino acid mutations found in Vpx (+) and Vpx (−) RT variants. A, the average number of amino acid mutations per cloned RT was plotted for Vpx (+) (black) and Vpx (−) (blue) RTs, with error bars representing standard deviation. Statistical significance from an unpaired two-tailed student's t test is indicated as **** p < 0.0001. B, RT clones were grouped by the number of mutations present in the amino acid sequence. The distribution of the number of amino acid mutations present in Vpx (+) and Vpx (−) RTs are shown using black and blue lines, respectively.

