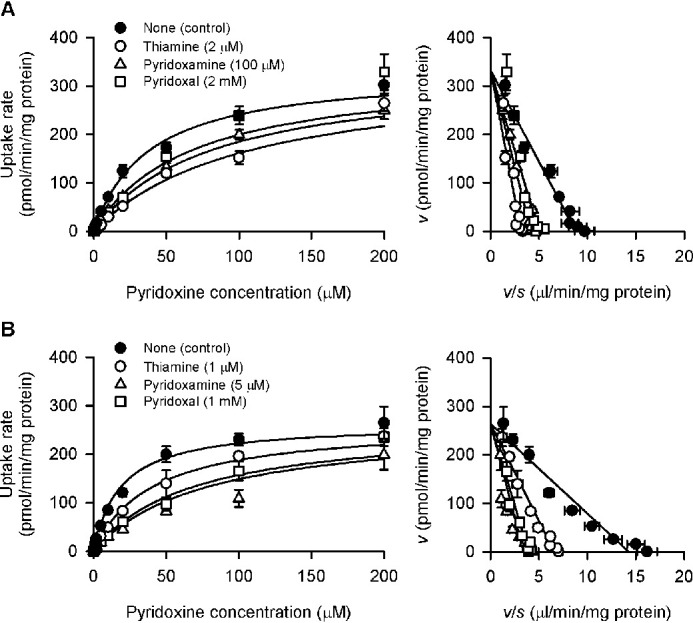
Figure 9.

Effect of selected compounds on concentration-dependent pyridoxine uptake by SLC19A2 and SLC19A3 stably expressed in MDCKII cells. The specific uptake of [3H]pyridoxine by SLC19A2 (A) and SLC19A3 (B) was evaluated at varied concentrations for 3 min at pH 5.5 and 37 °C in the presence of a test compound or in its absence for control. The profiles are transformed into the Eadie-Hofstee format in the right panels. The estimated values of Vmax, Km, and the inhibition constant (Ki) are presented in Table 2. The Ki values of thiamine are also presented in Table 1 for comparison with the IC50 values. Data are presented as the mean ± S.E. (n = 3).
