Figure 8.
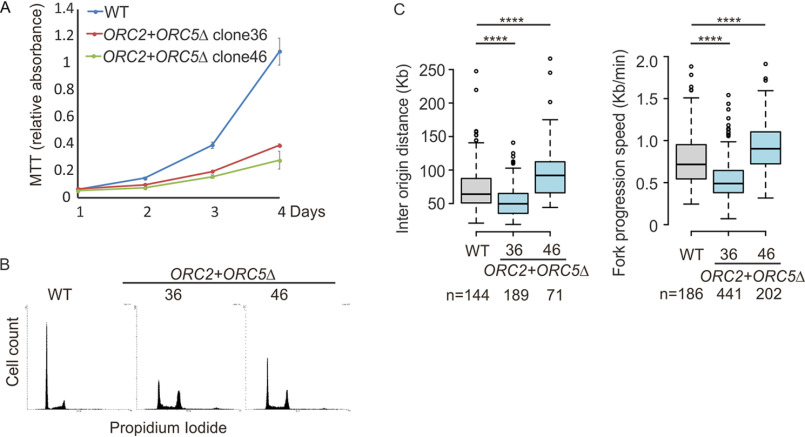
Cell proliferation and DNA replication in the ORC2+ORC5Δ cell lines. A, cell growth of indicated clones over 4 days, expressed as MTT absorbance. Mean ± S.D.; n = 3 biological replicates. B, cell cycle profile of propidium iodide–stained cells from indicated clones. C, DNA combing after a pulse labeling with IdU for 30 min followed by CldU for 30 min. Box and whisker plot is for interorigin distance (left) and fork progression speed (right). ****, P < 0.00001 between WT and ORC2+ORC5Δ clones in two-sided Mann-Whitney U test; N, number of tracks counted.

