Figure 8.

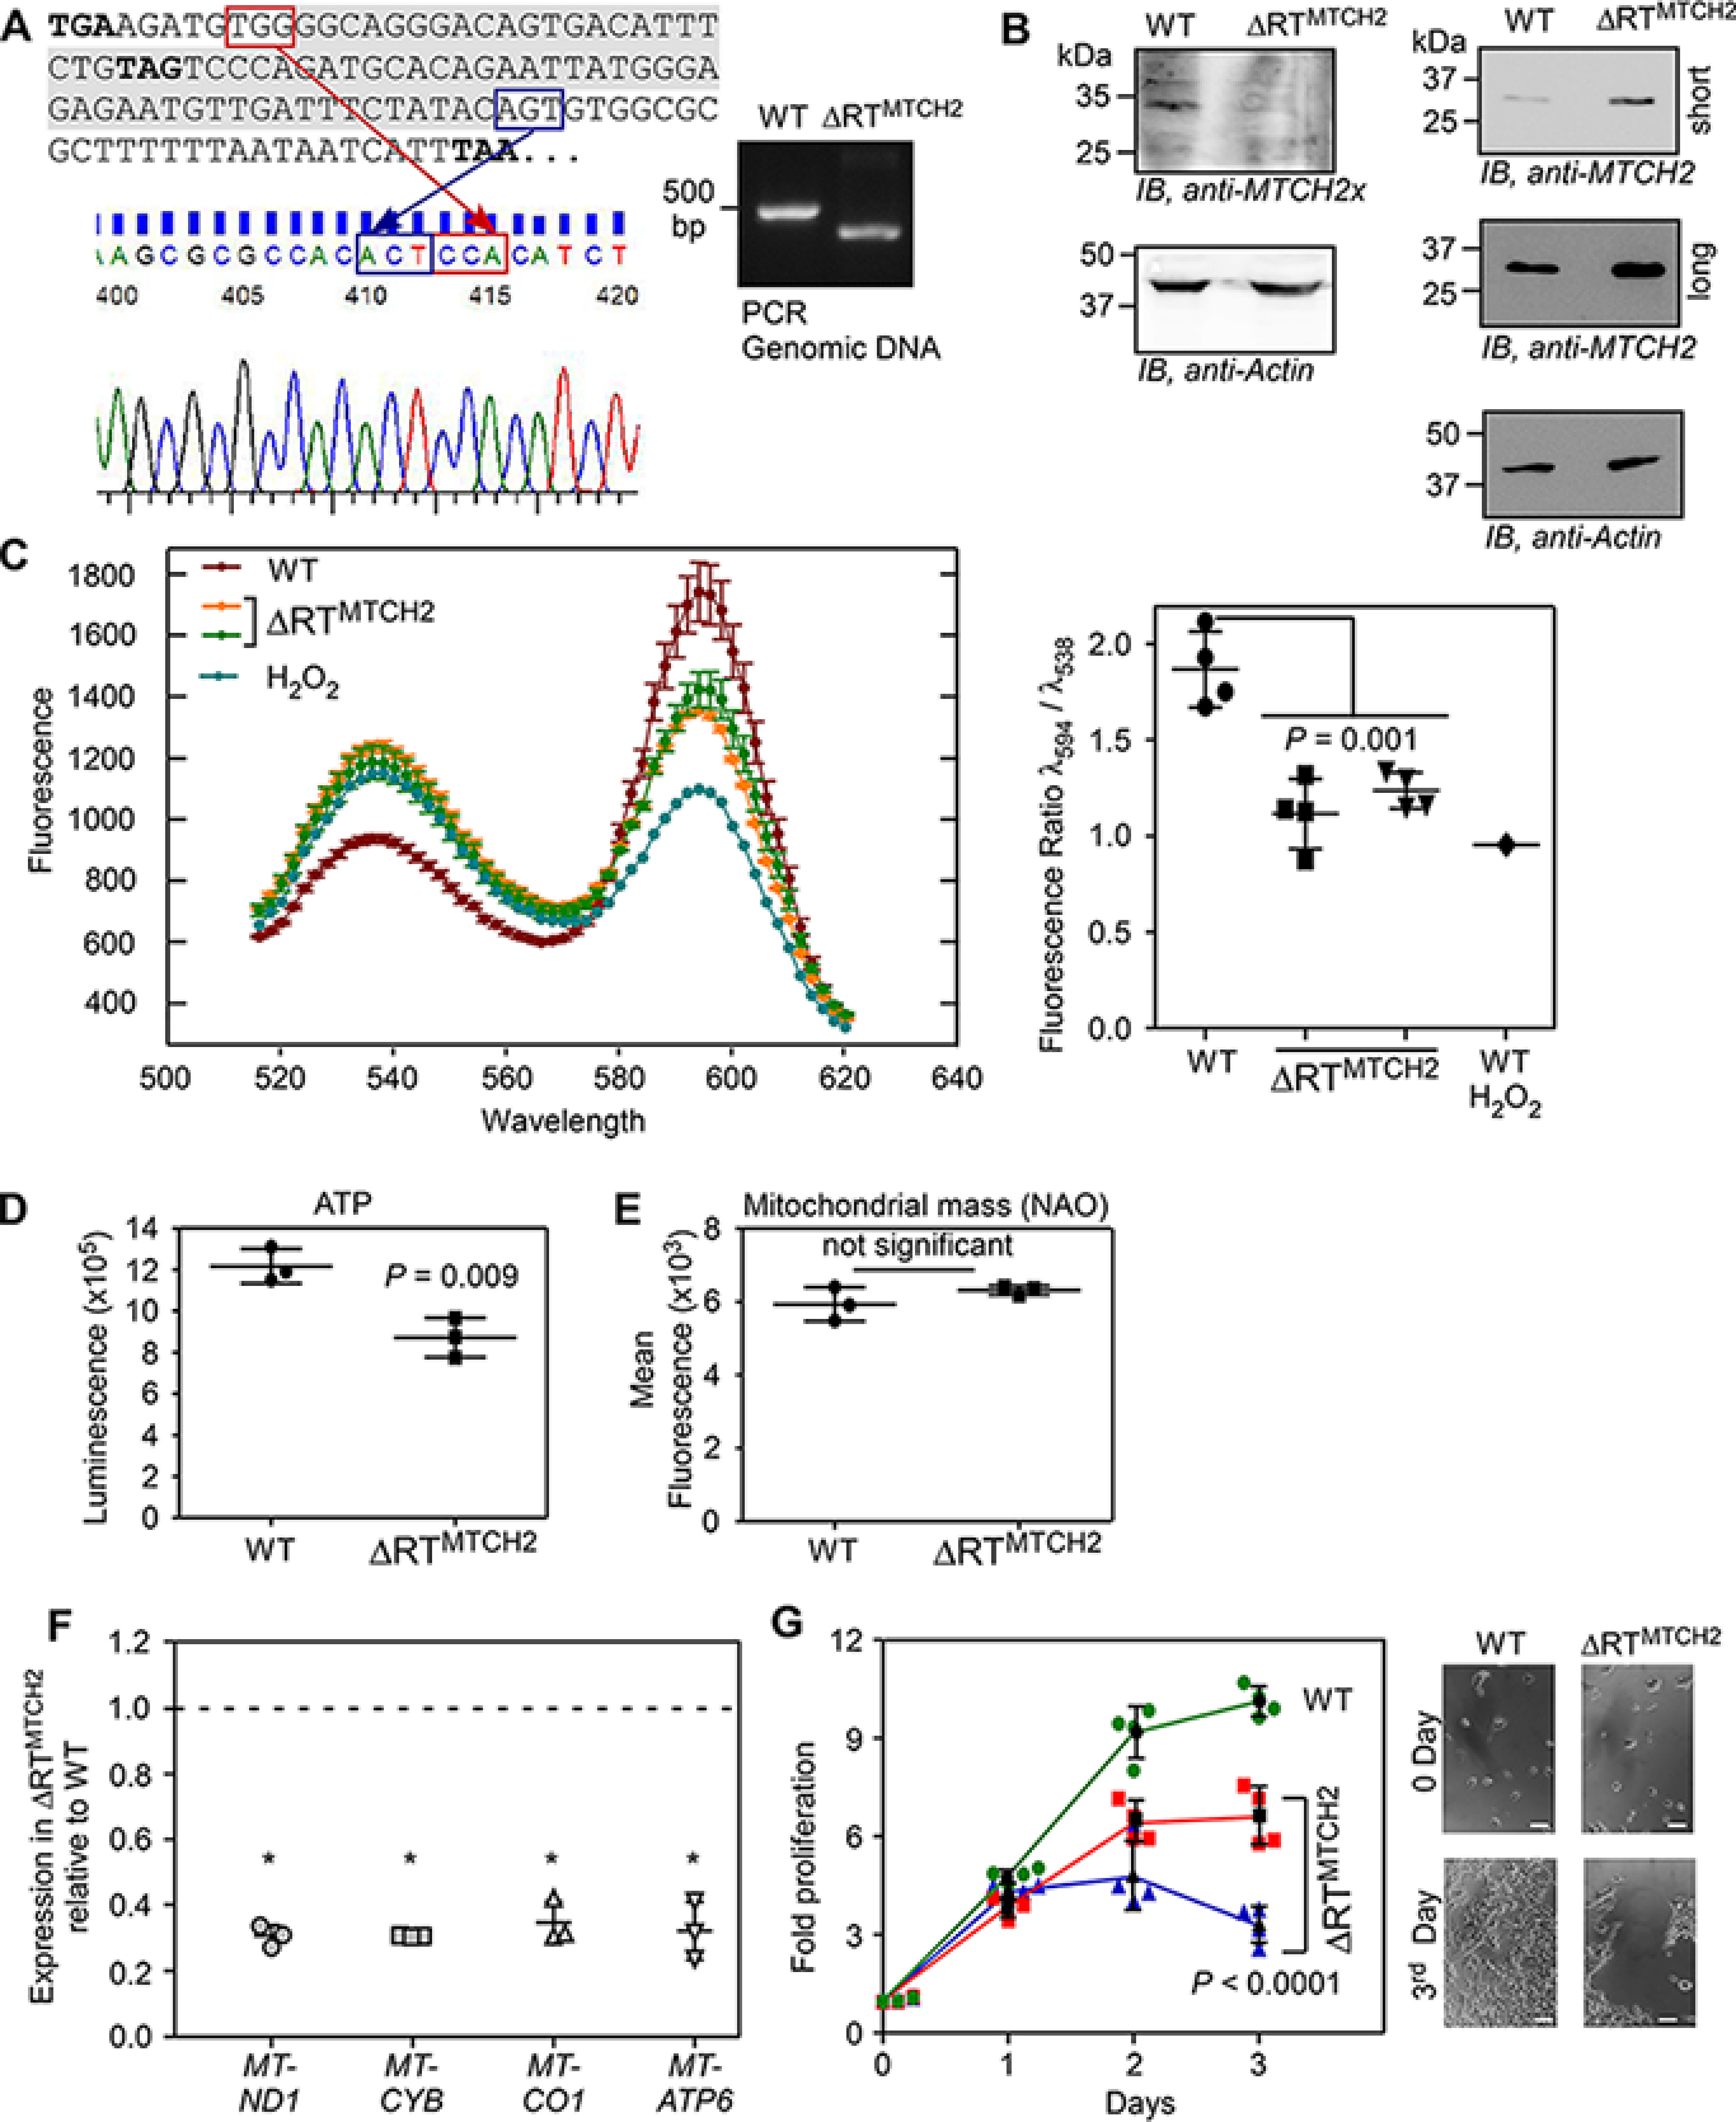
Double-SCR of MTCH2 is required to maintain normal mitochondrial membrane potential. A, CRISPR-Cas9 technique was used to delete the most part of ISR1 and ISR2 in the genome of HEK293 cells (termed ΔRTMTCH2). Deletion was confirmed by PCR amplification from genomic DNA using primers flanking the targeted region, and by sequencing the product. Sequencing was performed using a reverse primer that generated reverse-complement sequence. A part of this is shown as an electropherogram. The deleted part in ISR1 and ISR2 is shown in gray background. Three in-frame stop codons are shown in boldface. B, Western blotting showing the absence of MTCH2x and increased levels of MTCH2 in ΔRTMTCH2 cells compared with the WT cells (WT). Long and short exposures are shown for MTCH2. C, JC-1 fluorescence profile shows reduced mitochondrial membrane potential in two different ΔRTMTCH2 clones (left). H2O2 treatment was used as a positive control for mitochondrial membrane depolarization. Ratio of fluorescence at λ594 to λ538 is shown (right) (n = 4). D, ΔRTMTCH2 cells show reduced ATP levels compared with the WT cells. Cells were incubated in serum-free DMEM containing 10 μm galactose for 48 h before measuring ATP levels using a luminescence-based assay (n = 3). E, WT and ΔRTMTCH2 cells have comparable mitochondrial mass. The flow cytometry was performed using the fluorescent probe, nonyl acridine orange (NAO) (n = 3). F, quantitative real-time PCR analyses of the expression of mitochondrial genes that encode components of the mitochondrial respiratory chain complexes in WT and ΔRTMTCH2 cells. Expression of mitochondrial genes relative to that of ACTB (β-actin) was calculated using the 2−ΔΔCt method (n = 3). *, p < 0.01. G, proliferation profile of WT and two ΔRTMTCH2 clones. MTT assay was used to quantify proliferation (n = 4). Brightfield images of cells at 0 day and 3rd day are shown. Scale bar, 50 μm. All graphs show mean ± S.D. Results are representatives of at least three independent experiments done in triplicate. Two-tailed Student's t test was used to calculate the p value, except in G, where a two-way analysis of variance test was used.
