Figure 1.

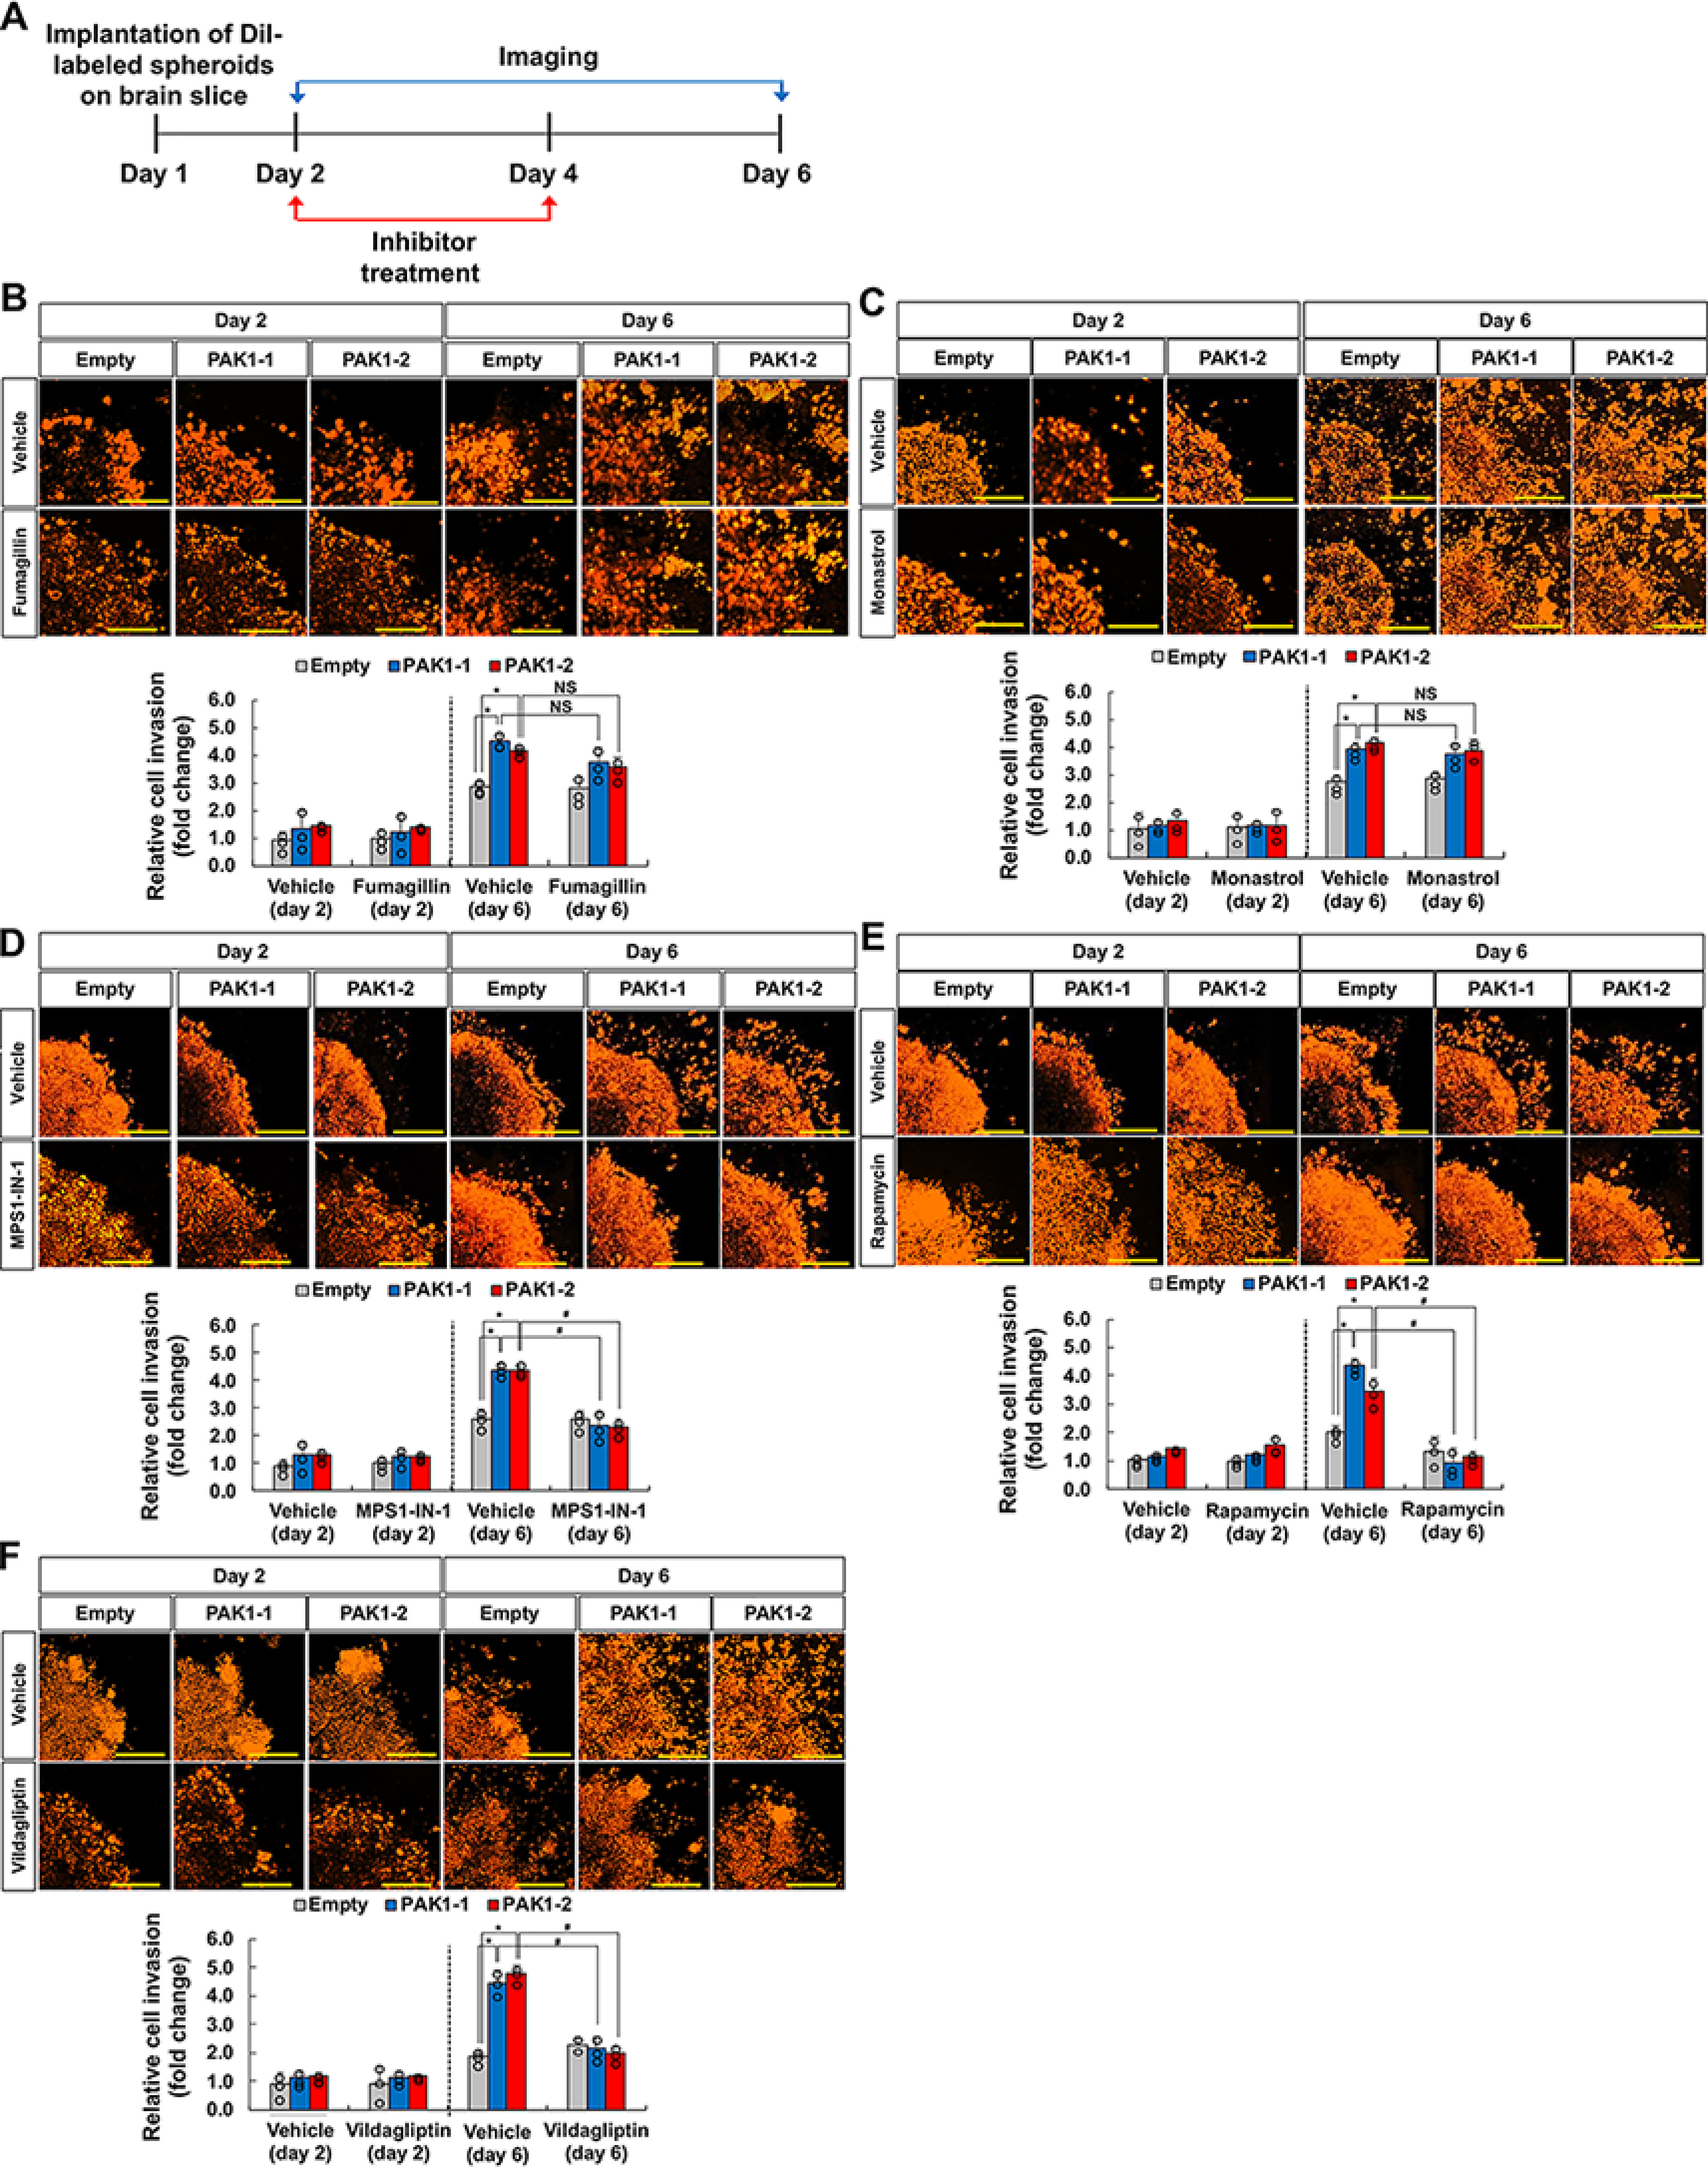
Evaluation of PAK1 genetic interactions in organotypic brain slices. A, experimental timeline. DiI-labeled spheroids were implanted onto brain slice cultures on day 1. Confocal imaging and inhibitor treatment were performed at the given time points. B–F, GL26 glioma spheroids stably expressing empty vector or PAK1 (GL26-PAK1-1 and GL26-PAK1-2) were implanted onto the slice cultures followed by treatment with vehicle or pharmacological inhibitors of potential PAK1 interaction partners: fumagillin, 1 nm (B); monastrol, 1 μm (C); MPS1-IN-1, 100 nm (D); rapamycin, 100 nm (E); vildagliptin, 250 nm (F). The Z-stack images were superimposed into a single image representing the entire spheroid. Invasive cell density was quantified as shown in the graphs. Scale bar, 200 μm. *, p < 0.05 (Student's t test comparing empty versus PAK1 groups, n = 3); #, p < 0.05 (Student's t test comparing vehicle versus inhibitor groups, n = 3); NS, not significant. Error bars, S.D.
