
Figure 4.
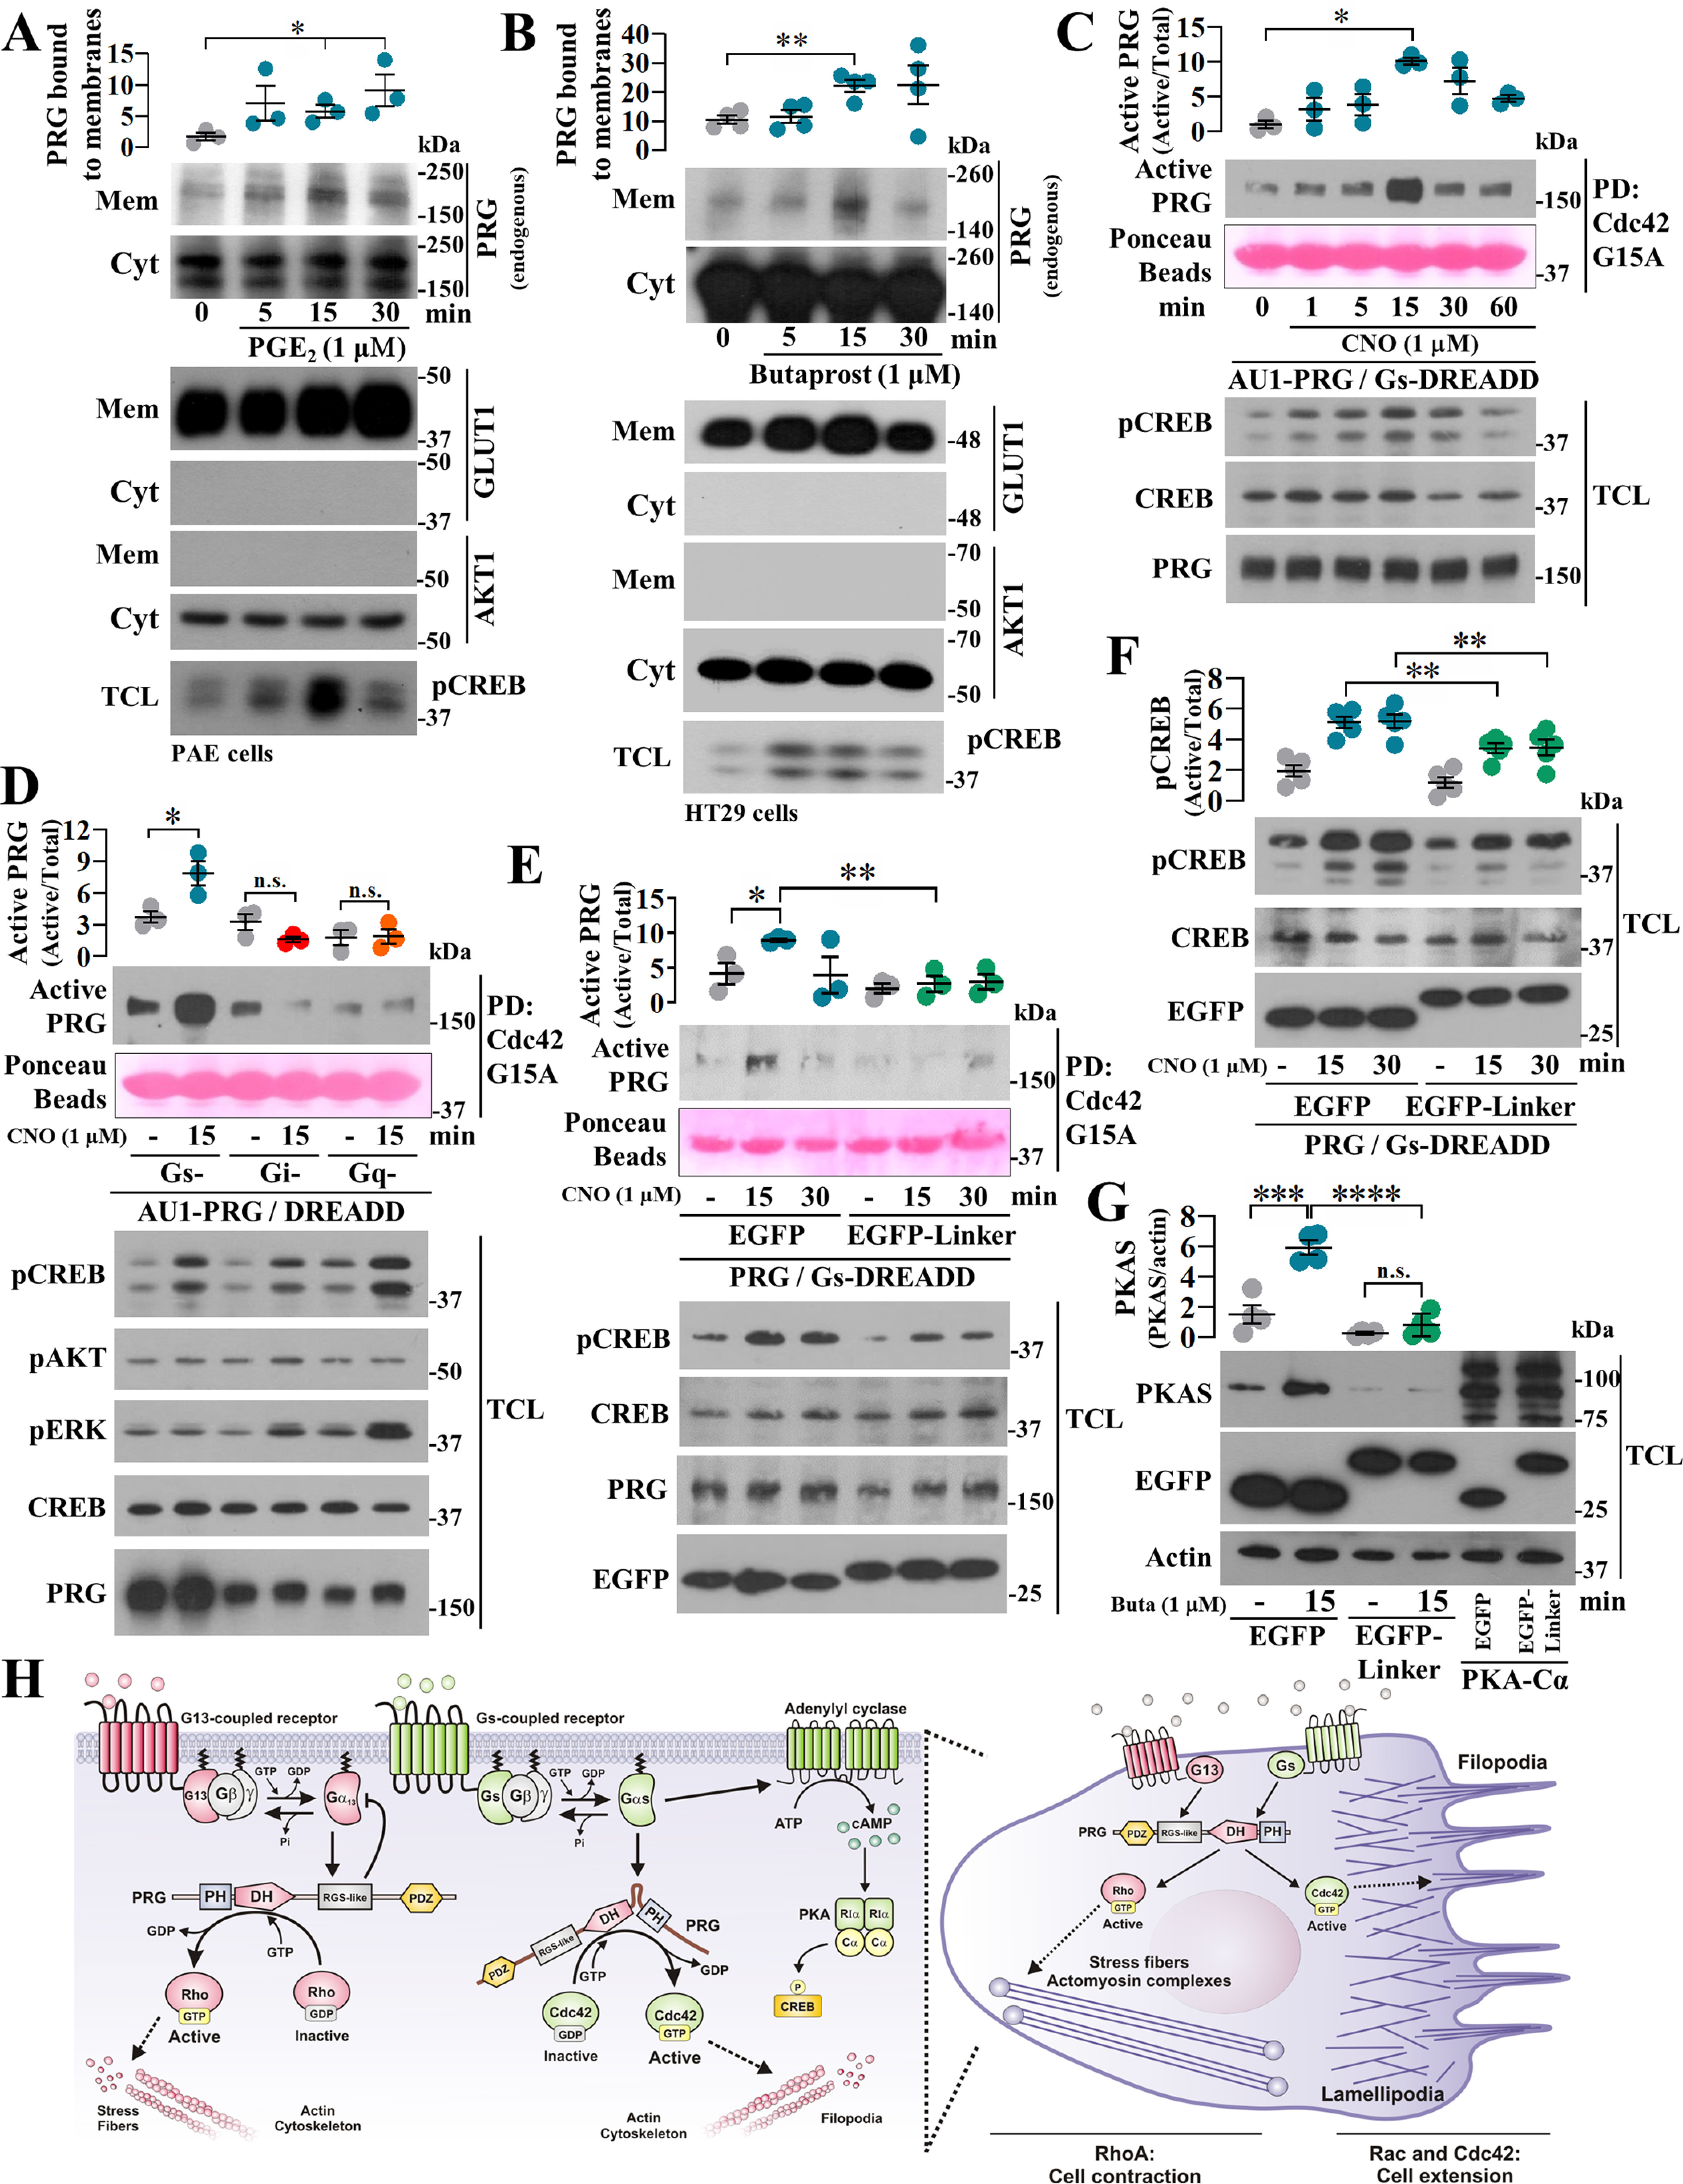
Agonist-dependent stimulation of Gs-coupled receptors enables PRG to bind Cdc42. A and B, membrane recruitment of endogenous PRG promoted by Gs-coupled GPCR signaling was assessed in PAE (A) and HT29 (B) cells stimulated with 1 μm PGE2 or butaprost, respectively. PRG in membrane fractions was revealed by Western blotting. GLUT1 and AKT1 were used as membrane and cytosolic markers, respectively. The graphs represent the means ± S.E. (n = 3, *, p < 0.05 in A; and n = 4, **, p < 0.01 in B; t test). C, time course of PRG·Cdc42 interaction was assessed in COS7 expressing Gs-DREADD receptors. The cells were stimulated with 1 µm CNO and subjected to Cdc42-G15A pulldown. The graph represents the means ± S.E. (n = 3). *, p < 0.05, one-way ANOVA followed Tukey. D, the effect of different endogenous heterotrimeric G proteins on PRG affinity for Cdc42 was studied in COS7 cells transfected with AU1-PRG and Gs-, Gi-, or Gq-DREADDs. The cells were stimulated with CNO for 15 min and subjected to Cdc42-G15A pulldown assays. The graph represents the means ± S.E. (n = 3). *, p < 0.05, one-way ANOVA followed Tukey. E, effect of the PRG-linker construct on agonist-stimulated interaction between PRG and Cdc42 was assessed in COS7 cells transfected with Gs-DREADD, AU1-PRG, and EGFP–PRG-linker or EGFP. The cells were stimulated with CNO for 15 and 30 min and subjected to Cdc42-G15A pulldown. The graph represents the means ± S.E. (n = 3). *, p = 0.0342; **, p = 0.0056, t test. F, effect of PRG-linker on agonist-dependent phosphorylation of CREB was assessed in COS7 cells expressing Gs-DREADDs and stimulated with CNO. The graph represents the means ± S.E. (n = 5). **, p < 0.01, t test. G, agonist-dependent phosphorylation of PKA substrates was assessed using PAE cells expressing EGFP or EGFP–PRG-linker and stimulated with butaprost. Lysates from EGFP-PKA-Cα−transfected cells served as control to detect PKA substrates. The graph represents the means ± S.E. (n = 4). ***, p = 0.0009; ****, p < 0.0001; n.s., no significance, one-way ANOVA followed Tukey. H, model depicts the canonical G13-PRG signaling axis to Rho and the emerging GPCR–Gαs–PRG–Cdc42 pathway based on the current findings. In cells, both systems putatively guide dynamic adjustments on actin-cytoskeleton reorganization.