Figure 1.
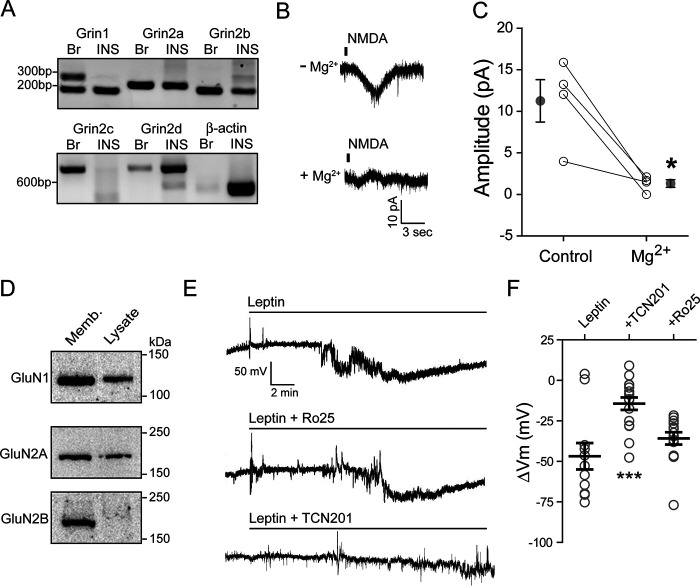
Leptin induces membrane hyperpolarization through GluN2A-containing NMDARs. A, RT-PCR detection of mRNA for NMDAR subunits, GluN1 (Grin1), GluN2A (Grin2a), GluN2B (Grin2b), GluN2C (Grin2c), and GluN2D (Grin2d), in rat brain (Br) and INS-1 832/13 cells (INS). β-Actin was included as a control. B, representative traces of NMDAR currents in the absence (top) or presence (bottom) of 100 μm Mg2+. C, sensitivity of NMDA currents (elicited by puff application of 1 mm NMDA) to Mg2+ block. Averaged current amplitudes before (control) and after 100 μm Mg2+ for each cell are connected by a straight line. Mean ± S.E. values for each group are shown next to individual data points. *, p < 0.05 by paired t test. D, Western blots showing protein expression of GluN1, GluN2A, and GluN2B from INS-1 832/13 cell membrane fraction (Memb; 30 µg) and total cell lysate (Lysate; 30 µg). E, individual cell-attached membrane recordings from INS-1 832/13 cells treated with leptin (10 nm) alone (top), with leptin plus the GluN2B inhibitor Ro 25-6981 (middle; Ro25, 1 μm), or with leptin plus the GluN2A inhibitor TCN201 (bottom; 50 μm). F, group data showing the degree of membrane hyperpolarization in mV for leptin alone (n = 11 cells) or leptin co-applied with Ro 25-6981 (n = 14 cells) or TCN201 (n = 16 cells). Here and in subsequent figures, individual cells are represented by symbols and means are indicated by a black line. Error bars, S.E. ***, p < 0.0005 by unpaired t test as compared with leptin.

