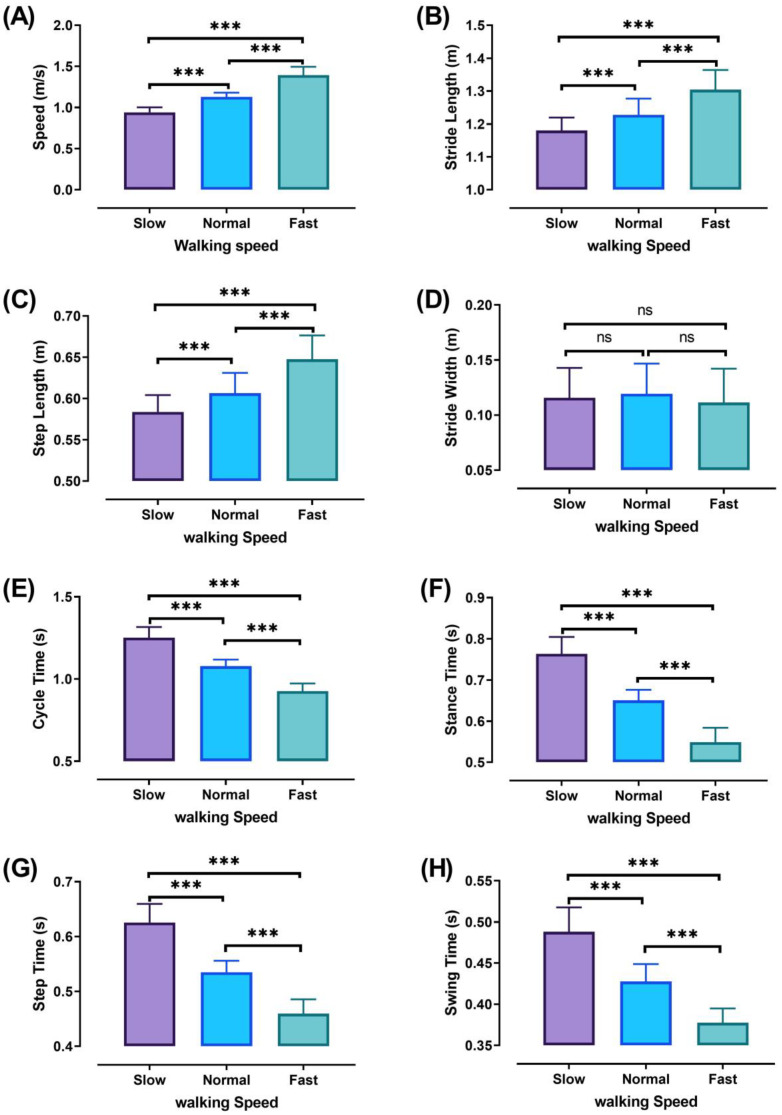
Figure 5.
Walking characteristics at different speeds (Slow, Normal, and Fast). walking speed (A), stride length (B), step length (C), stride width (D), cycle time (E), stance time (F), step time (G), and swing time (H). ANOVA results showing the differences of walking characteristics during walking speed (Slow, Normal, and Fast). Asterisk signs above the line represent significant differences between walking speeds: (***) indicates p ˂ 0.001, and (ns) indicates non-significant.

