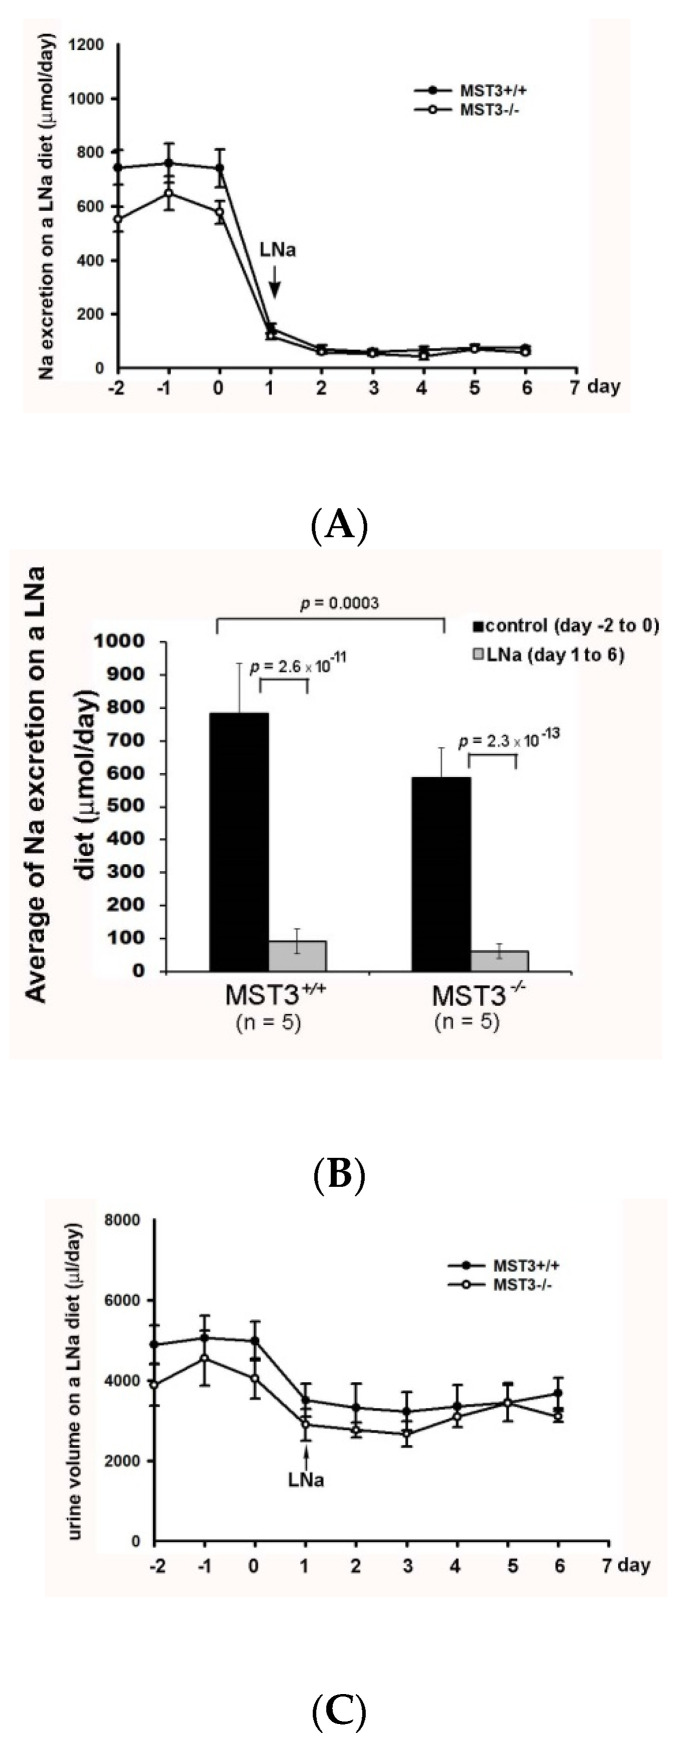
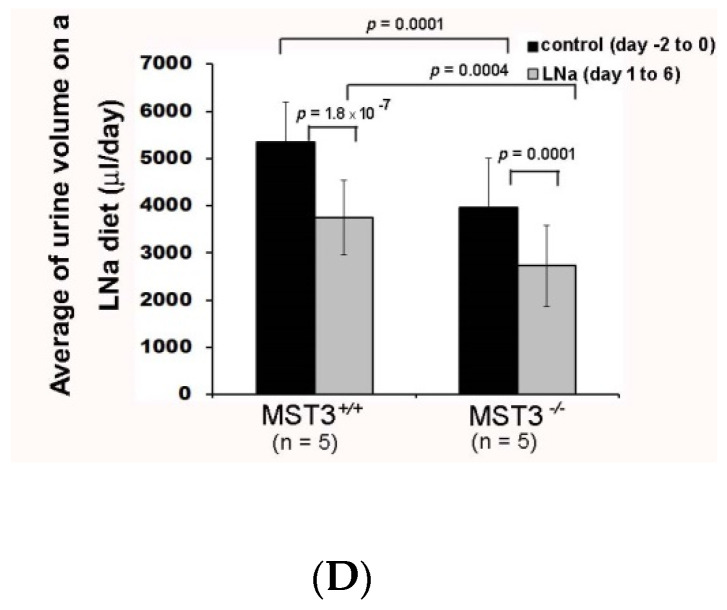
Figure 1.
Urinary Na+ excretion and urine volume on a low Na (LNa) diet. Wild-type (WT) (MST+/+) (●) and MST3−/− (○) mice were fed the control diet for 3 days; then, the diet was changed to the LNa diet for an additional 16 days. The average group values were used to generate the graphs, and the error bars correspond to SE. Urinary Na+ excretion (A) and urine volume (C) were recorded over 9 days. The bar graphs (B,D) show the average of the data in (A,C), respectively.


